Monitoring Dataflows with Hamilton + Datadog
Integrate DDOG + more with one line of code
We listen closely to our open-source community. One of the most frequent lines of questioning for current + potential users is “How can Hamilton work with X (tool I’m pushing to integrate with/have already paid for)?”. As we just built out a new lifecycle plugin framework, the answers we give have generally moved from maybe, with some caveats to yes, with <20 minutes of work!
This is the first of a series of integration posts, in which we:
Show how to use Hamilton with some framework X, usually through a new plugin or a set of best practices
Discuss trade-offs of using X for a set of common use-cases
Talk about alternatives to X and how Hamilton makes it easy to swap between them and compare.
We gear these posts towards those who want to/are already using X, who want to/are already using Hamilton, or who want to better understand the problems space that X solves.
We’ll start off with one of the most common requests we’ve gotten, Datadog. For those who don’t know, Datadog is a widely-used infrastructure/service visibility vendor with a host of powerful capabilities. In this post we will be focusing on Datadog’s distributed tracing capability.
We will start with an overview of the OS library Hamilton, dig into two specific Hamilton use-cases, show how you gain visibility into those use-cases by integrating Datadog’s distributed tracing feature, and talk about swapping/comparing with other tools that solve similar problems.
First, let’s introduce Hamilton; if you’re already familiar skip to the next section.
Hamilton
If you are more of a learn-by-doing type, we recommend spending a few minutes on tryhamilton.dev to grok the following concepts, then skipping ahead to the next section.
Hamilton is a standardized way to build dataflows (any code that processes data) in python. The core concepts are simple – you write each transformation step as a single python function, with the following rules:
The name of the function corresponds to the output variable it computes.
The parameter names (and types) correspond to inputs. These can be either passed-in parameter or names of other upstream functions.
# simple_pipeline.py

def digits_df() -> pd.DataFrame:
    """Load the digits dataset."""
    digits = datasets.load_digits()
    _digits_df = pd.DataFrame(digits.data)
    _digits_df["target"] = digits.target
    return _digits_df

def digits_model(digits_df: pd.DataFrame) -> svm.SVC:
    """Train a model on the digits dataset."""
    clf = svm.SVC(gamma=0.001, C=100.)
    _digits_model = clf.fit(
          digits_df.drop('target', axis=1),
          digits_df.target
    )
    return _digits_model

def predicted_digits(
       digits_model: svm.SVC,
       input_digits: pd.DataFrame) -> pd.Series:
    """Predict the digits."""
    return pd.Series(digits_model.predict(input_digits))
Together, Hamilton turns the functions into a Directed Acyclic Graph (DAG) for execution. To actually run the code, you instantiate a driver. You tell the driver what you need and it will run only the required functions.

import simple_pipeline
from hamilton import driver

# create a driver (this uses the builder API), passing in modules
dr = (
    driver
    .Builder()
    .with_modules(simple_pipeline)
    .build()
)

# run the desired (+ upstream) nodes
results = dr.execute(
    ['predicted_digits'],
    inputs={"input_digits" : _load_data(...)}
)
In summation, Hamilton is simply a way of organizing your code into a graph of functions. You can use it anywhere well-organized code is valuable (everywhere), and logic can be modeled with a DAG (most applications that manage the movement of data/objects).
Let’s dig into two different use-cases and how Hamilton can help. While we’ve narrowed these down to illustrate, they allude to broader applications, so read on even if you’re not working on Machine Learning (ML)/ Large Language Models (LLMs).
ML Pipelines
While Hamilton was initially built for feature engineering, we quickly found that it was a great tool to manage entire ML pipelines, a.k.a. ETLs. See the code above for an example.
Note that Hamilton excels at representing most pipelines – if ML is not your bread and butter, feel free to s/ML/your_expertise/g the rest of this post. The batch observability use-case is not one to which Datadog is typically applied, and this is something we’ll dig into in a bit.
What do you care about in visibility for ML Pipelines? It varies. Monitoring often attempts to answer some of these questions (and more):
Is my pipeline getting less performant?
If so, what are the bottlenecks?
Is my data still good?
Has my model trained well (does the loss curve converge)?
And so on – note that you tend to care about both the data concerns (ML specific), and the system concerns.
To answer these, you have a variety of tools:
Macro-orchestration systems often come with some visibility - e.g. did the task run & complete?
Offline profiling tools (either logged or inspecting tables in your warehouse).
Data quality/lineage solutions (vendor-provided).
While there are many approaches to the above, these often require adding hooks in your code with various callouts to external services.
LLM RAG Applications
Along with batch jobs, Hamilton is widely used to express request-level service logic. More recently, we’ve observed an influx of engineers leveraging Hamilton to run Retrieval Augmented Generation for inference with LLMs. While this example does not do retrieval (just generation), you can easily imagine extending it to query results from a vector DB.
def base_system_prompt() -> str:
    """The base system prompt for summarizing text."""
    return """You are a summarization expert that knows how to extract key points from text."""

def base_prompt_template(content_type: str = "a blog") -> str:
    """The base prompt template."""
    return f"""Summarize this text from {content_type}. Extract any key points with reasoning.

Content:

{{content}}"""

def summarize_user_prompt(
    base_prompt_template: str,
    raw_text: str) -> str:
    """Final prompt for summarizing a chunk of text."""
    return base_prompt_template.format(content=raw_text)

def summarized_text(
    base_system_prompt: str,
    summarize_user_prompt: str,
    llm_name: str
) -> str:
    response = LLM_LIBRARY.ChatCompletion.completion(
        model=llm_name, messages=[
          {"role": "system", "content": base_system_prompt},
          {"role": "user", "content": summarize_chunk_of_user_prompt}
        ], temperature=0
    )
    return response["choices"][0]["message"]["content"]
To integrate Hamilton with a web service, you would typically store a driver as a global variable and have each endpoint pass it data from the request, compute the DAG, and return the output (often a final node that compiles data into a pydantic model).
from hamilton import driver
dr = driver.Driver(...)
app = App(...)

@app.get("/v0/api/summarize_text")
def summarize_text(input_text: str) -> str:
    return dr.execute(
        ['summarized_text'],
        inputs={
            'llm_name' : 'gpt-3.5-turbo',
            'raw_text': input_text}
    )['summarized_text']
This use-case can be generalized to pretty much all online applications. So, if LLMs are not your day-to-day, feel free to s/RAG/microservice/g the rest of this post. For more information on running Hamilton in an online setting, see the writeup on Hamilton + FastAPI.
In instrumenting LLM RAG applications (and microservices in general), you care about the data and the performance as well:
Does the response make sense?
Is the latency acceptable?
Where is the bottleneck in your code?
How much are you spending on external APIs (OpenAI)?
To answer these, you would typically instrument your code. Datadog, for instance, can provide answers to (2) and (4) with minimal changes (see Datadog monitors and OpenAI integration). Answering (3) requires significant instrumentation/use of the profiling feature in Datadog.
Integrating Datadog
Both of the above cases can use the same Hamilton integration with datadog. This leverages lifecycle adapters, and can be added with a single line of code:
from hamilton.plugins import h_ddog
from hamilton import driver

datadog_hook = h_ddog.DDOGTracer(root_name="hamilton_dag_trace")

dr = (
    driver
    .Builder()
    .with_modules(...)
    .with_adapters(datadog_hook)
    .build()
)
dr.execute(...)
As you can see, all we’re doing is:
Instantiating a DDOGTracer with a grouping span
hamilton_dag_traceIntegrating it with our driver and executing it
Behind the scenes, the DDOGTracer implements a set of hooks that Hamilton calls at various stages in execution. These occur before and after the graph runs, a new task is spawned, or an individual function is executed. It maintains state, allowing it to specify span links from nodes to their dependencies and accurately capture the parent-child relationship of runs -> tasks -> nodes.
Looking at these in datadog, we have quite a few examples (read the captions for explanation/context).

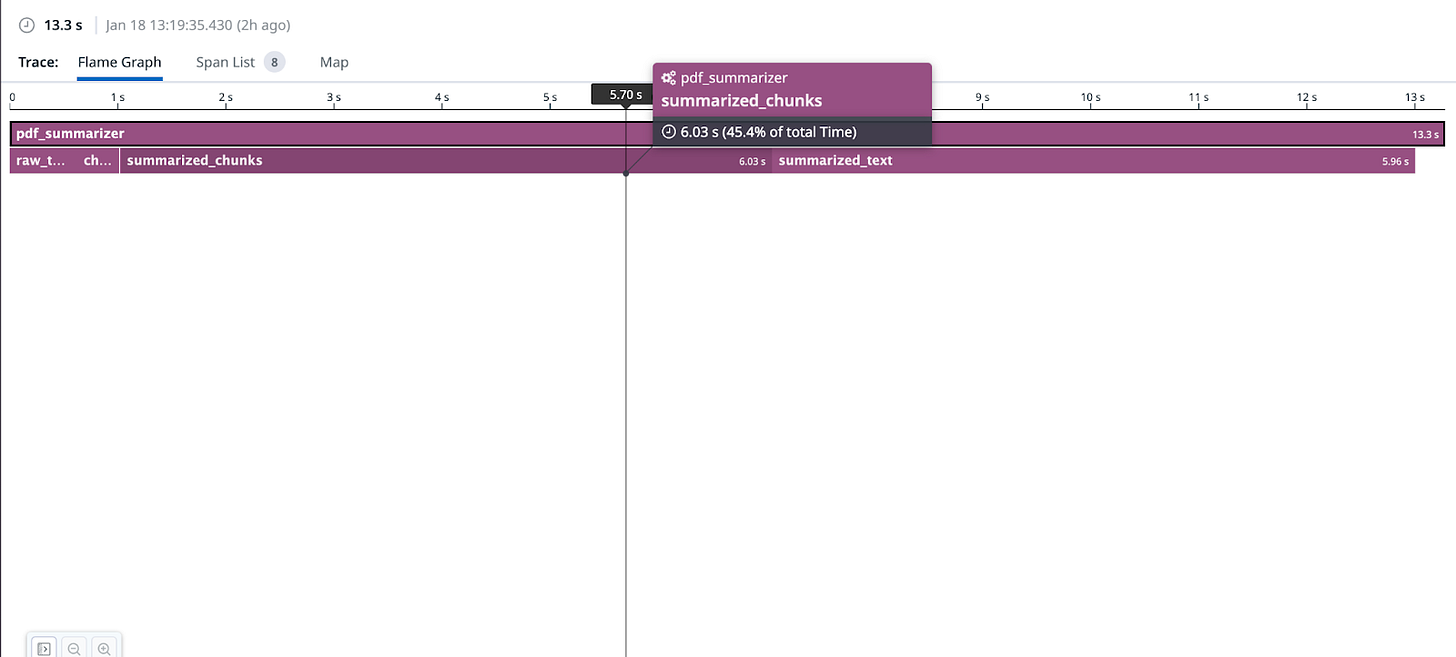

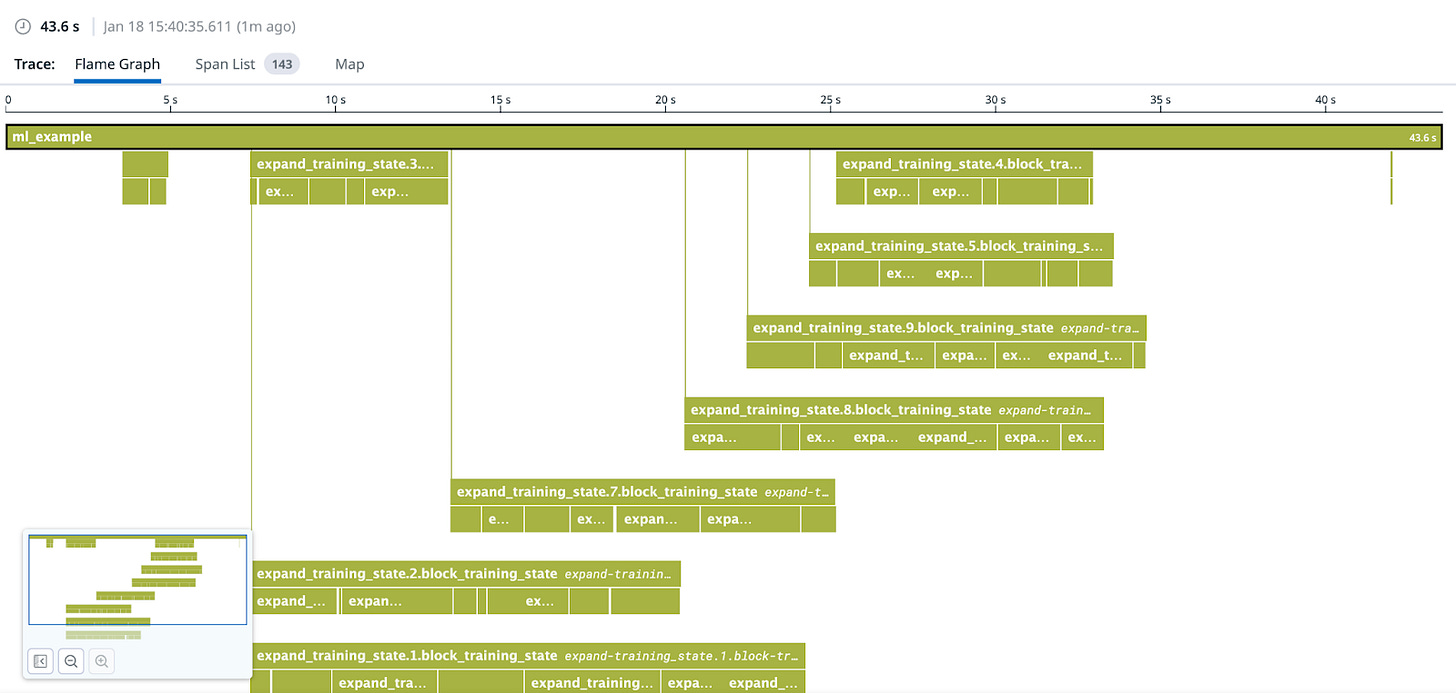
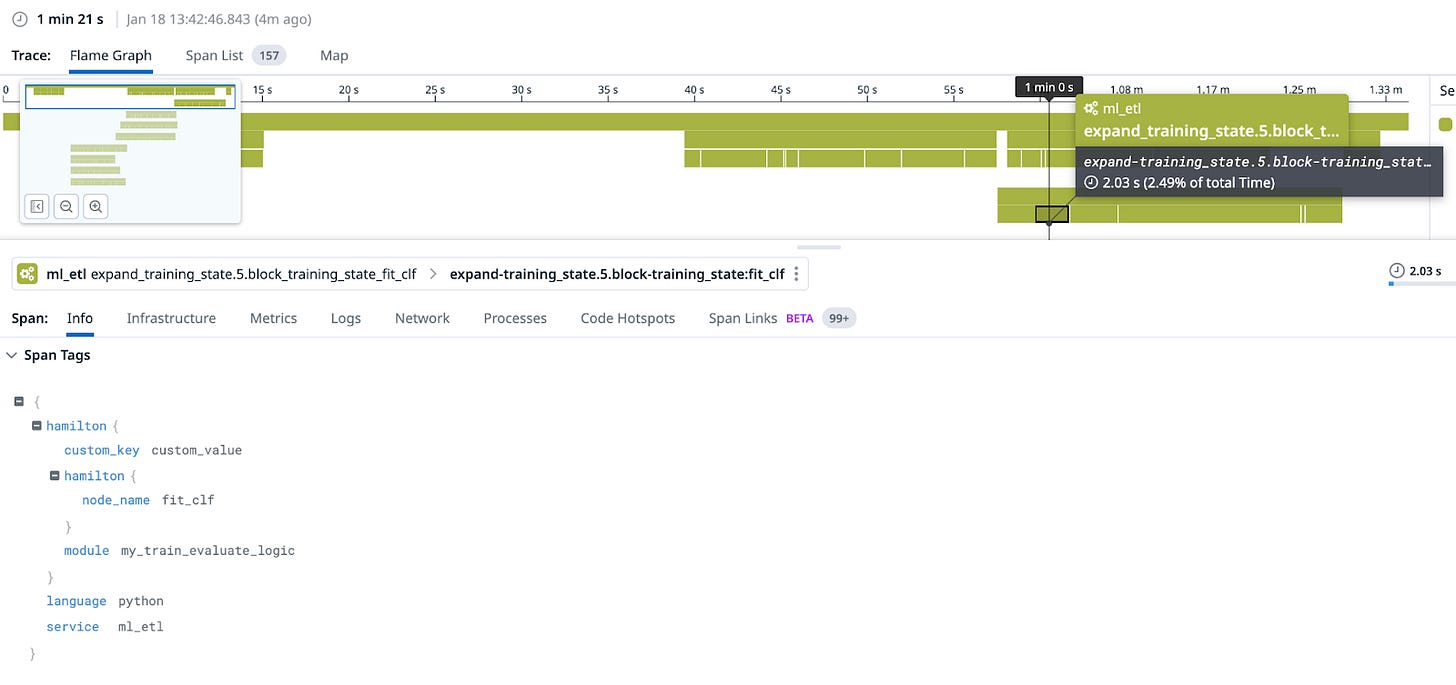
hamilton. to the tags).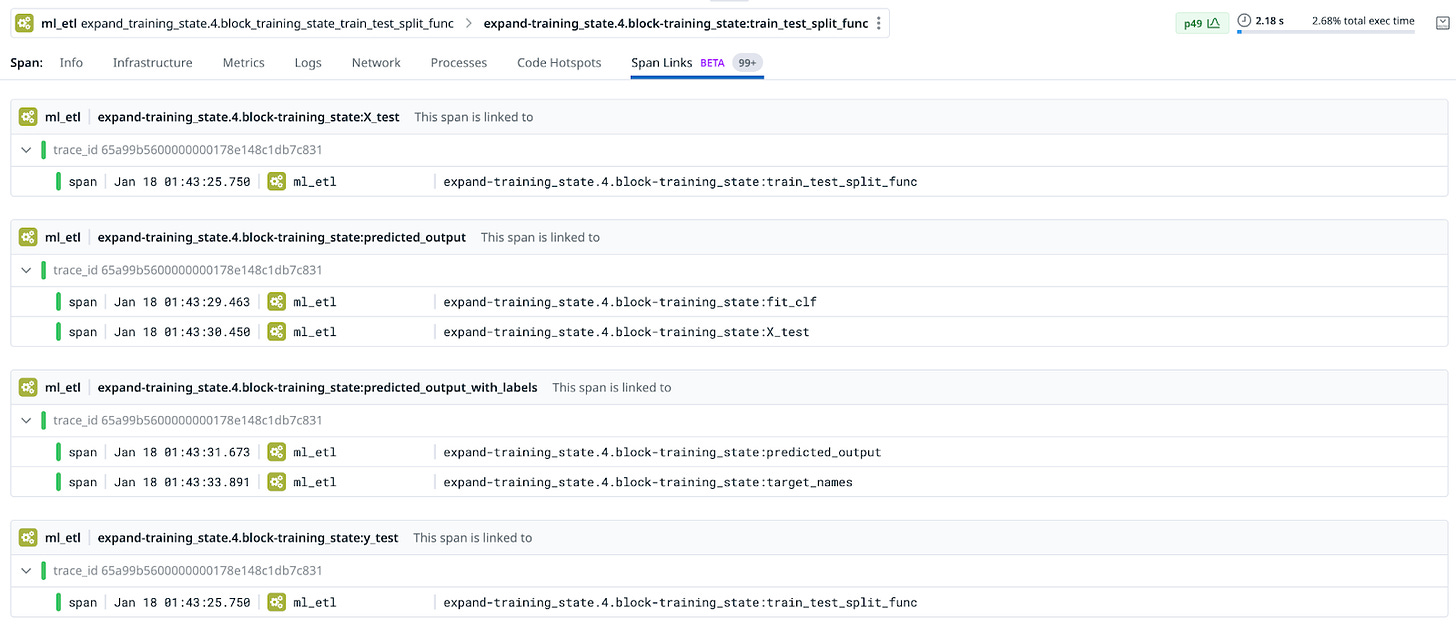
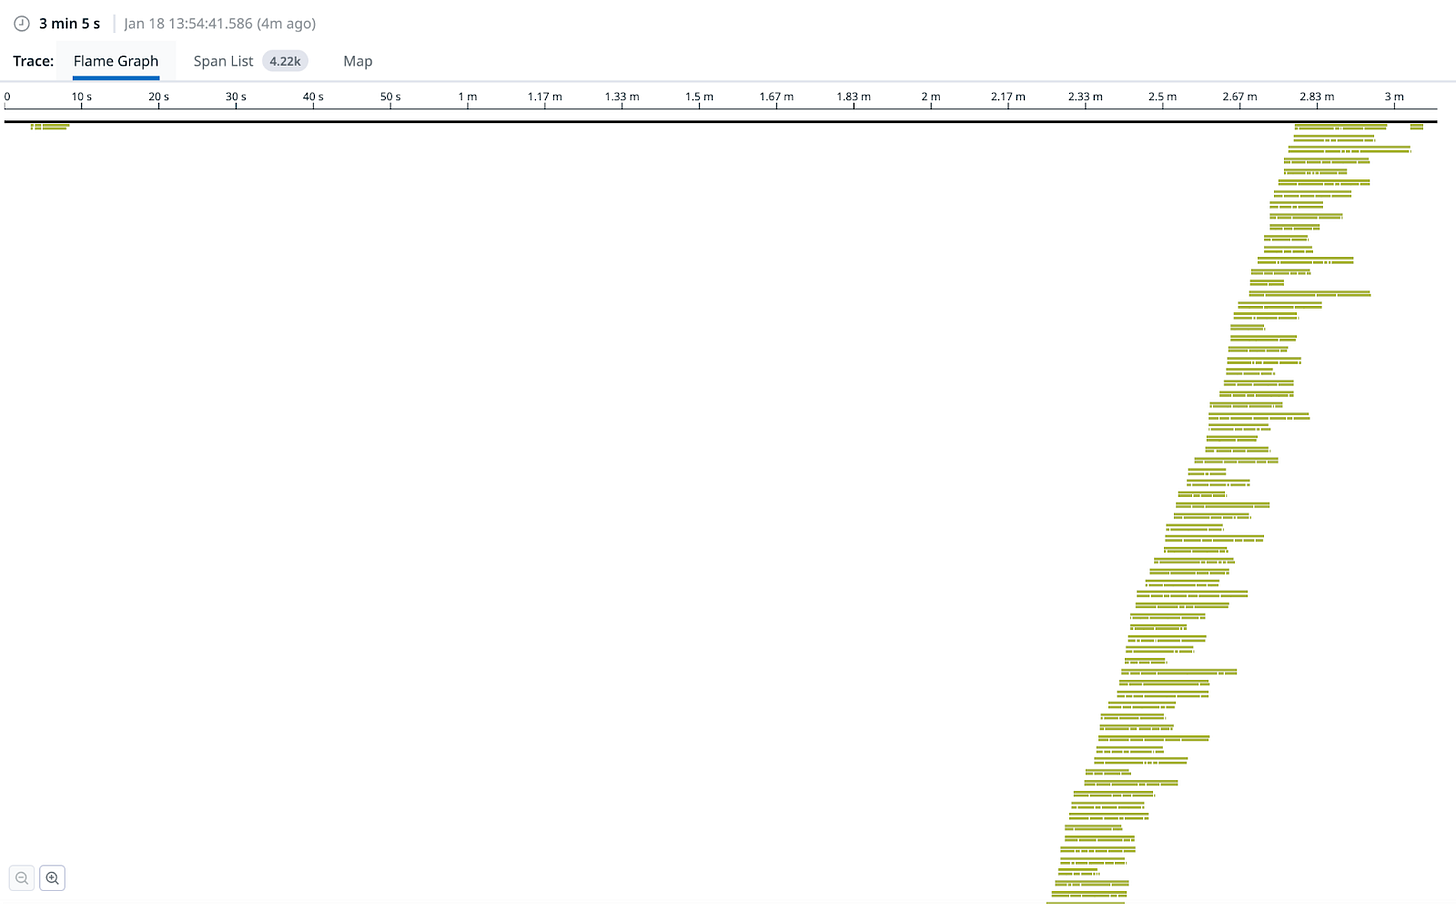
As you can see, Hamilton with Datadog monitoring forms a clean way of profiling your dataflow! Each function corresponds to a span, so you get a fine-grained view into exactly what your code is doing and how long it takes. You can do all of this without polluting your code with with tracer() statements, muddling logical concerns with telemetry concerns to get deeper insight (as illustrated in the code below, which can be simplified with Hamilton + DDOG).
def some_artifact(some_input: pd.DataFrame) -> pd.DataFrame:
    with tracer.trace("do_something"):
        input = do_something(some_input)
    with tracer.trace("do_something_else"):
        do_something_else(input)
    return input
Furthermore, should you want to (a) make the span part of a broader trace or (b) add more specific spans (within functions), you can opt to use the datadog tracer API directly and the implementation will automatically set parent/children spans (although, as shown above, watch out for readability/decoupling concerns).
Back to our Use Cases
Let’s go back to the monitoring concerns we talked about above:
ML Pipelines
Is my pipeline getting less performant?
If so, what are the bottlenecks?
Is my data still good?
Has my model trained well (does the loss curve converge)? Does this hold up against the validation set?
Hamilton’s (current) Datadog integration will happily answer (1) and (2) – you can create metrics to track spans/determine bottlenecks, etc. The fact that it instruments each step makes it easy to identify/improve bottlenecks, which will map directly to your code. It does not address (2) or (3), however.
LLM RAG Apps
Does the response make sense?
Is the latency acceptable?
Where is the bottleneck in your code?
How much are you spending on external APIs (OpenAI)?
The Hamilton/datadog integration we showed will help with (2) and (3). Datadog has capabilities for additional OpenAI monitoring, (which should be easy to integrate although we have not done so yet), but (1) is not a Datadog concern.
Trade-offs
There are a few other benefits to this approach (Datadog + Hamilton) for the microservice/RAG setting (that we have not shown in this post):
You can hook this up with any other services by setting the trace context before calling Hamilton, allowing you to trace data across service boundaries, into your DAG, and back to the client.
You can gather specific metrics on function-level performance, which follows naturally from the structure of Hamilton
Datadog stores and displays exception-level information
There are, however, some drawbacks:
Trace retention is low. While this is fine with a high-volume (LLM/RAG service), you might not be able to find the ML pipeline that ran, say, three weeks ago.
Traces tend to run for longer in a pipeline setting – while we have not observed a maximum span duration in Datadog, it does not have streaming of full trace results so you won’t see what’s happening until the DAG completes.
The dependency visualization capabilities (E.G. viewing your dataflow as a DAG) are rudimentary, although we expect this to improve given that the feature is in beta. This is not a replacement for a lineage system.
You can’t link the spans to the code that was actually run (although you probably could do something clever/hacky with tags…).
You have no view into the data – ETLs often break because data looks off, and this won’t help you debug.
Evaluation
For a microservice/LLM setting (aside from cost, which is yours alone to consider), this is a no-brainer. In fact, it’s a step up from most other Datadog integrations we’ve observed – very few of them naturally provide visibility into the logic of your code. This could significantly improve your experience working with LLM APIs, which can be notoriously slow and unreliable. Some ideas:
You can tag OpenAI calls with metadata to look at their latency/success rate over time.
You can monitor the latency of your vector DB by setting up metrics on spans.
You can bottleneck the slowest component of your generative AI pipeline and add caching for latency reduction.
For ML Pipelines, this likely fits in the “can’t hurt” category (cost calculations aside) – having visibility + tracing is always better than not, and when combined with Hamilton, Datadog does give some unique insight.
Alternatives
One of the values of a one-line change is that you can easily swap out for alternative providers. The unique value of Hamilton is that the abstraction (with the addition of lifecycle adapters) allows you to do this with ease, running multiple integrations at once while not touching the code itself. (Keep your code clean! Your infrastructure and monitoring it should be a separate concern.)
While we have implemented only Datadog’s tracing capabilities, integrating with a competitor such as Signoz or Middleware should be as easy as a one-line change ( contribute back if you build the integration, please! Or, better yet, build an OpenTel integration!).
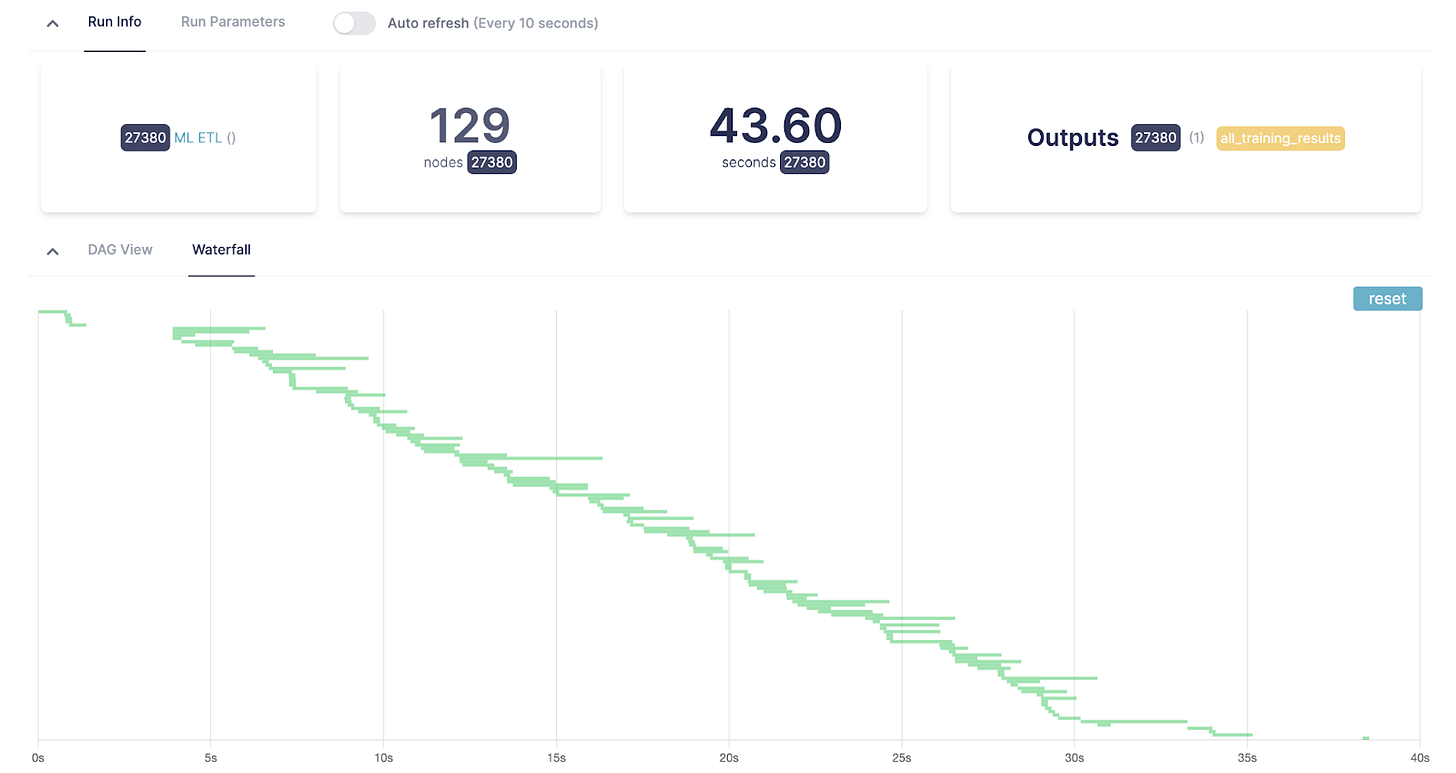
At DAGWorks, we’re creating an observability platform for dataflows that works well with Hamilton and can complement a distributed tracing system such as Datadog. It is meant for both a development and production setting, and includes lineage metadata and a catalog (so you can keep track of how things connect and artifacts produced). It also takes the form of a single-line addition (similar to Datadog). It’s free to sign up and try out!
from dagworks.adapters import DAGWorksTracker

tracker = DAGWorksTracker(
    project_id=project_id_from_the_ui,
    api_key=os.environ["DAGWORKS_API_KEY"],
    username="my_email@my_organization.com",
    dag_name="my_dag_name",
)

dr = (
    driver
    .Builder()
    .with_modules(...)
    .with_adapters(tracker)
)
dr.execute(...)
It can help provide mid-execution visibility for pipelines as it streams results in, provides visualizations in terms of DAGs (with the associated code), and stores/displays data summaries for completed nodes (prompts, dataframes, etc…).
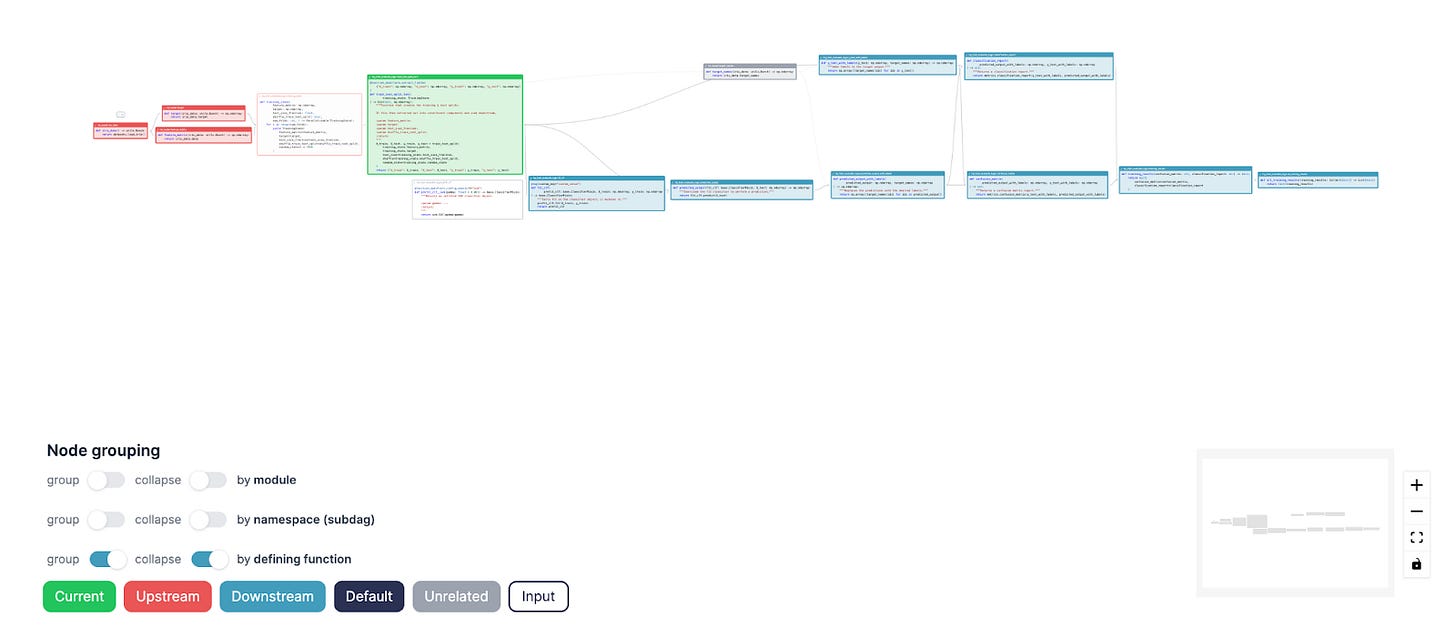
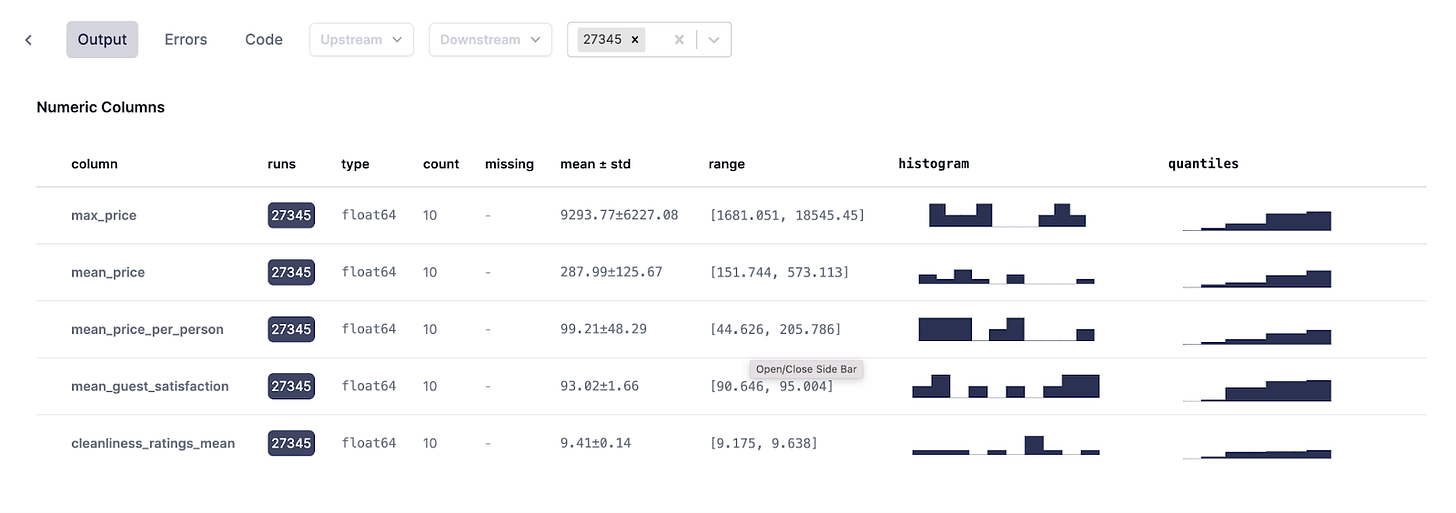
Looking back at the initial monitoring requirements above, we can see how DAGWorks can help round out some of the other use-cases. In particular, you can monitor the outputs/prompts to your LLM queries, gain insight into the data generated and used in your ML Pipelines, and visualize the results of intermediate run artifacts, including data and metrics.
Next Steps/References
So, if you’re asking yourself what tools to use, the answer is, most likely, why not both? Datadog provides invaluable insight into system performance, attaches it to a variety of other metrics, and gives you some incredibly clean and powerful UIs for managing distributed tracing. Hamilton allows you to gain more value out of Datadog, instrumenting your traces with fine-grained details that make the logic clear. Furthermore, it allows you to easily swap out/plug in tooling without touching the code for the logic itself.
DAGWorks gives you information to really dig into the performance of your LLMs + ML models and understand exactly how the data materializes.
A mixture of tools that complement each other nicely is often the best approach, as you can never fully predict what production problem you’ll hit and what solutions will prove most beneficial. Hamilton can help you plug and play, and swap between/add new integrations.
In summation, we:
Discussed how to use Hamilton for two cases – batch ML Pipelines and online RAG services
Presented the new Datadog integration
Talked about trade-offs of using Datadog for both of those cases
Talked a little about Datadog alternatives/complements, how Hamilton can be used to swap between them/toggle them on and off, and how DAGWorks picks up the slack where Datadog leaves off.
We’re really excited about the future of data pipelines. As everything in Hamilton is open-source, you can play a role as well! We are looking for contributions – please share back any successful integrations you build.
To get started:
Read the post on lifecycle adapters
Look over the DDOG integration
Check out a few of the included hooks
Download a dataflow from the hub to test it with
We Want to Hear from You
If you’re excited by any of this, or have strong opinions, drop by our Slack channel / or leave some comments here! Some resources to get you help:
📣 join our community on Slack — we’re more than happy to help answer questions you might have or get you started.
⭐️ us on GitHub
📝 leave us an issue if you find something
Other Hamilton posts you might be interested in:


