Hamilton UI: Streamlining Metadata, Tracking, Lineage/Tracing, and Observability for Your Dataflows
Hamilton not only standardizes code, but now comes with a UI to view lineage & provenance, track artifacts, & observe execution of your Hamilton dataflows; integrate with a single line code change!
TL;DR: We open sourced a UI
Hamilton, the micro-framework that helps scientists and engineers define testable, modular, self-documenting dataflows, now comes with an open source self-hostable UI for tracking and displaying dataflow metadata. Specifically it:
Exposes a catalog of transforms and artifacts; everything that your code is and what it interacted with.
Shows lineage / traces & provenance of your code & artifacts.
Shows execution observability; see profiling, traces, errors pinpointed at the function level, and telemetry.
Is self-populating – just a one-line addition to your code keeps the data in the UI up to date.
Can be used across a wide variety of use cases. From data processing, to feature engineering & model building, to RAG document processing, to introspecting actions agents take, to processing web-service requests.
We’re excited to add more to Hamilton to provide a complete set of capabilities that can be used from development to production, for data, machine learning, large language model workflows; basically anything that can be described as a Directed Acyclic Graph (DAG).
With these additions, Hamilton now (1) provides any team the rigor and power of what was previously only available to sophisticated data & ML teams, and (2) provides this without the overhead of having to hire people to maintain and integrate many separate systems. This means that rather than having to prioritize which capabilities to spend time integrating, you can get them all with a single line code change!
If you’re in a hurry you can do the following on a command line to get the UI up & running:
pip install"sf-hamilton[ui,sdk]"
hamilton ui
In this post we’ll recap Hamilton, then explain our motivation for the capabilities in the UI. We will then walk through what these new UI capabilities are and how to integrate with them in one line of code. We’ll finish with an overview of how we plan to delineate enterprise features, along with our roadmap that includes capturing open lineage and also instrumentation for non-Hamilton code. Note: If you’re less interested in reading, there are two videos at the bottom that introduce getting started and cover some features of this new UI.
What is Hamilton?
For those unfamiliar with Hamilton here’s a quick primer. Hamilton is a lightweight in-memory framework that helps you express dataflows, i.e. pipelines that can span data, machine learning, LLM, and even web requests.
By using Hamilton, you standardize your code, which enables you and your team to iterate faster. Standardization comes in the form of writing Python functions in a way that enables Hamilton to build a pipeline from. Specifically, Hamilton builds a pipelines by stitching together function and parameter names:
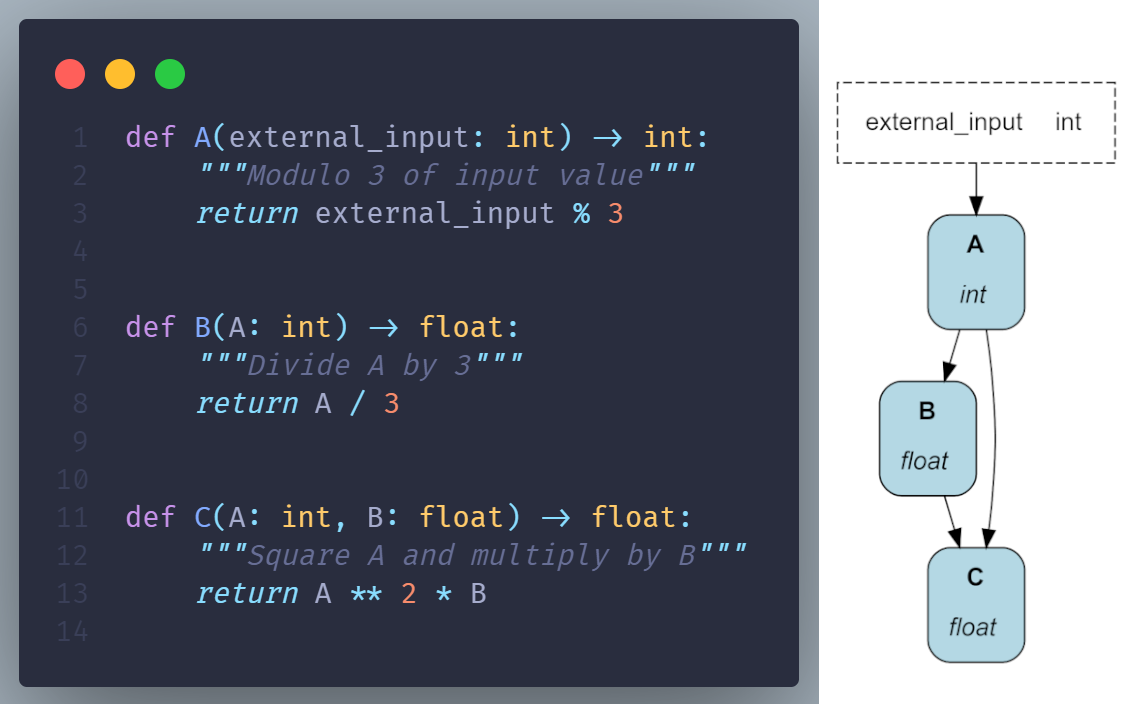
This results in code that has a standard shape and feel to it:
Everything is unit testable
Everything is documentation friendly
Code is modular and reusable
You can even walkthrough your code base visually (Hamilton can draw a picture for you)
Hamilton comes with many other features, and for more details on what they are and how to use them, we refer you to check out the following posts:
Our Motivation
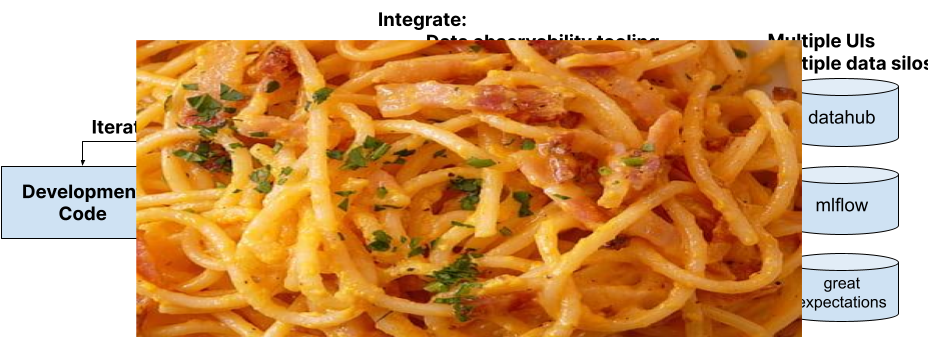
Some of the features we built into Hamilton come from our experience building, managing, and maintaining the MLOps stack for 100+ data scientists at Stitch Fix. For example, all observability tools (Datadog, WandB, etc] & catalogs [Datahub, Amundsen, etc] require you to spend time integrating with their SDKs to populate what those systems capture. The process to do so looks something like the following:
The “hello world” promise of all these tools/systems is simple, just add a few lines and you’re integrated and getting value. But in practice here’s what we’ve experienced happen:
Implementation of these SDKs is inconsistent and is done differently by different persons
This leads to a wide distribution of usefulness of what’s captured
This then causes:
A negative feedback cycle, especially in the case of catalogs, where it’s a system nobody bothers with because there’s nothing useful in it, so why spend integration time to send things to it?
It can also lead to more tools being used for the same use case, e.g. MLFlow & WandB, which further fragments the maintenance and upkeep picture.
Overtime this all leads to:
A tough time upgrading or migrating integrations since everybody has done things differently and inconsistently.
Trouble gaining an overall picture of the state of production systems & what is actually going on. You have to view quite a few systems.
From a management or business perspective, this ultimately leads to:
Technical debt
Wasted budgets spent on tools & people to manage them
Lost productivity & opportunities for leverage because the tools aren’t fully utilized.
This can be visualized as the following:
For anyone to have a chance to really avoid these problems, you need standardization. Which, unless you can afford a platform team to provide and enforce one, you’re going to struggle with accomplishing; take our word for it.
That is, unless you’re using something like Hamilton!
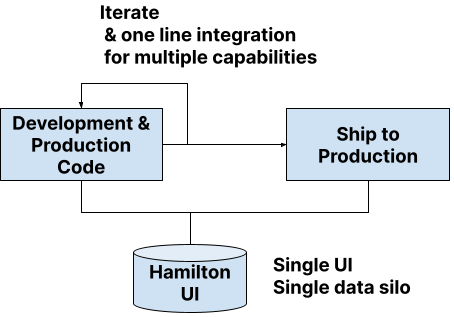
We specifically designed Hamilton to make it straightforward to use, but also modular and configurable. Most systems design one at the expense of the other, but we think we’re threading the needle here to make managing and adding “platform capabilities”, which require configuration and modularity, simpler to maintain and manage, without detriment to the user experience. We’re very proud that we can offer enterprise grade capabilities by only requiring you to add one additional line to your Hamilton code, along with a UI (and system) that this one-line integrates with.
In practice, this effectively means that there isn’t a distinction between development and production code to be made if you’re using Hamilton. You don’t need hand-off, and you can use these capabilities in development as well as production:
Side note: why should you care about lineage, observability, catalogs, etc. tools?
One word - trust. We’re not going to dive into it in this post, but if you’re building a serious business that uses data, ML, & AI in a differentiating fashion, you’re going to need processes and observability so that you can be trustworthy. For example, your boss wants to know you can chase down explanations for weird product behavior, which is hard if you don’t know what your systems did/are doing. Similarly your CEO/stakeholders want to know that if they give you more resourcing, you can use it effectively to deliver increased returns for the business. This is hard to do without the right processes, introspection, and observability as you scale your team and processes out. Therefore it’s a matter of when, not if, on needing these capabilities.
The Hamilton UI: A Self-Populating Metadata Catalog
In this section we’ll go through the features of the UI and explain the capabilities provided. We term it a metadata catalog because of all the details & information captured about your dataflow.
Changes to Hamilton code
To make use of these capabilities, other than spinning up the self-hosted service, all that’s required is a one-line addition to your Hamilton code, and that’s by building a HamiltonTracker object and providing it to your Hamilton Driver at construction time:
# pip install "sf-hamilton[sdk]" to get `hamilton_sdk`
from hamilton_sdk import adapters

tracker = adapters.HamiltonTracker(
   project_id=PROJECT_ID,
   username=EMAIL_YOU_PUT_IN_THE_UI,
   dag_name="my_version_of_the_dag",
   tags={"environment": "DEV",
         "team": "MY_TEAM",
         "version": "X",
         "run_id": "..."}
)

dr = (
  driver.Builder()
    .with_config(your_config)
    .with_modules(*your_modules)
    .with_adapters(tracker)  <--- the one line we add.
    .build()
)
# use the driver as you would
If you’re not impressed that it’s just a single line, consider the contra of not using Hamilton. The effort required to find, enumerate, and implement all the places in code to provide what we’re going to show you would be no small feat for a moderately sized team. Imagine then the difference in upkeep. To put it more viscerally, imagine having to find every place your data is loaded, transformed, and saved, and adding a `log_X` line to it. It’s not impossible, but it is a lot of work. Here’s it’s just a single line for everything that your code runs.
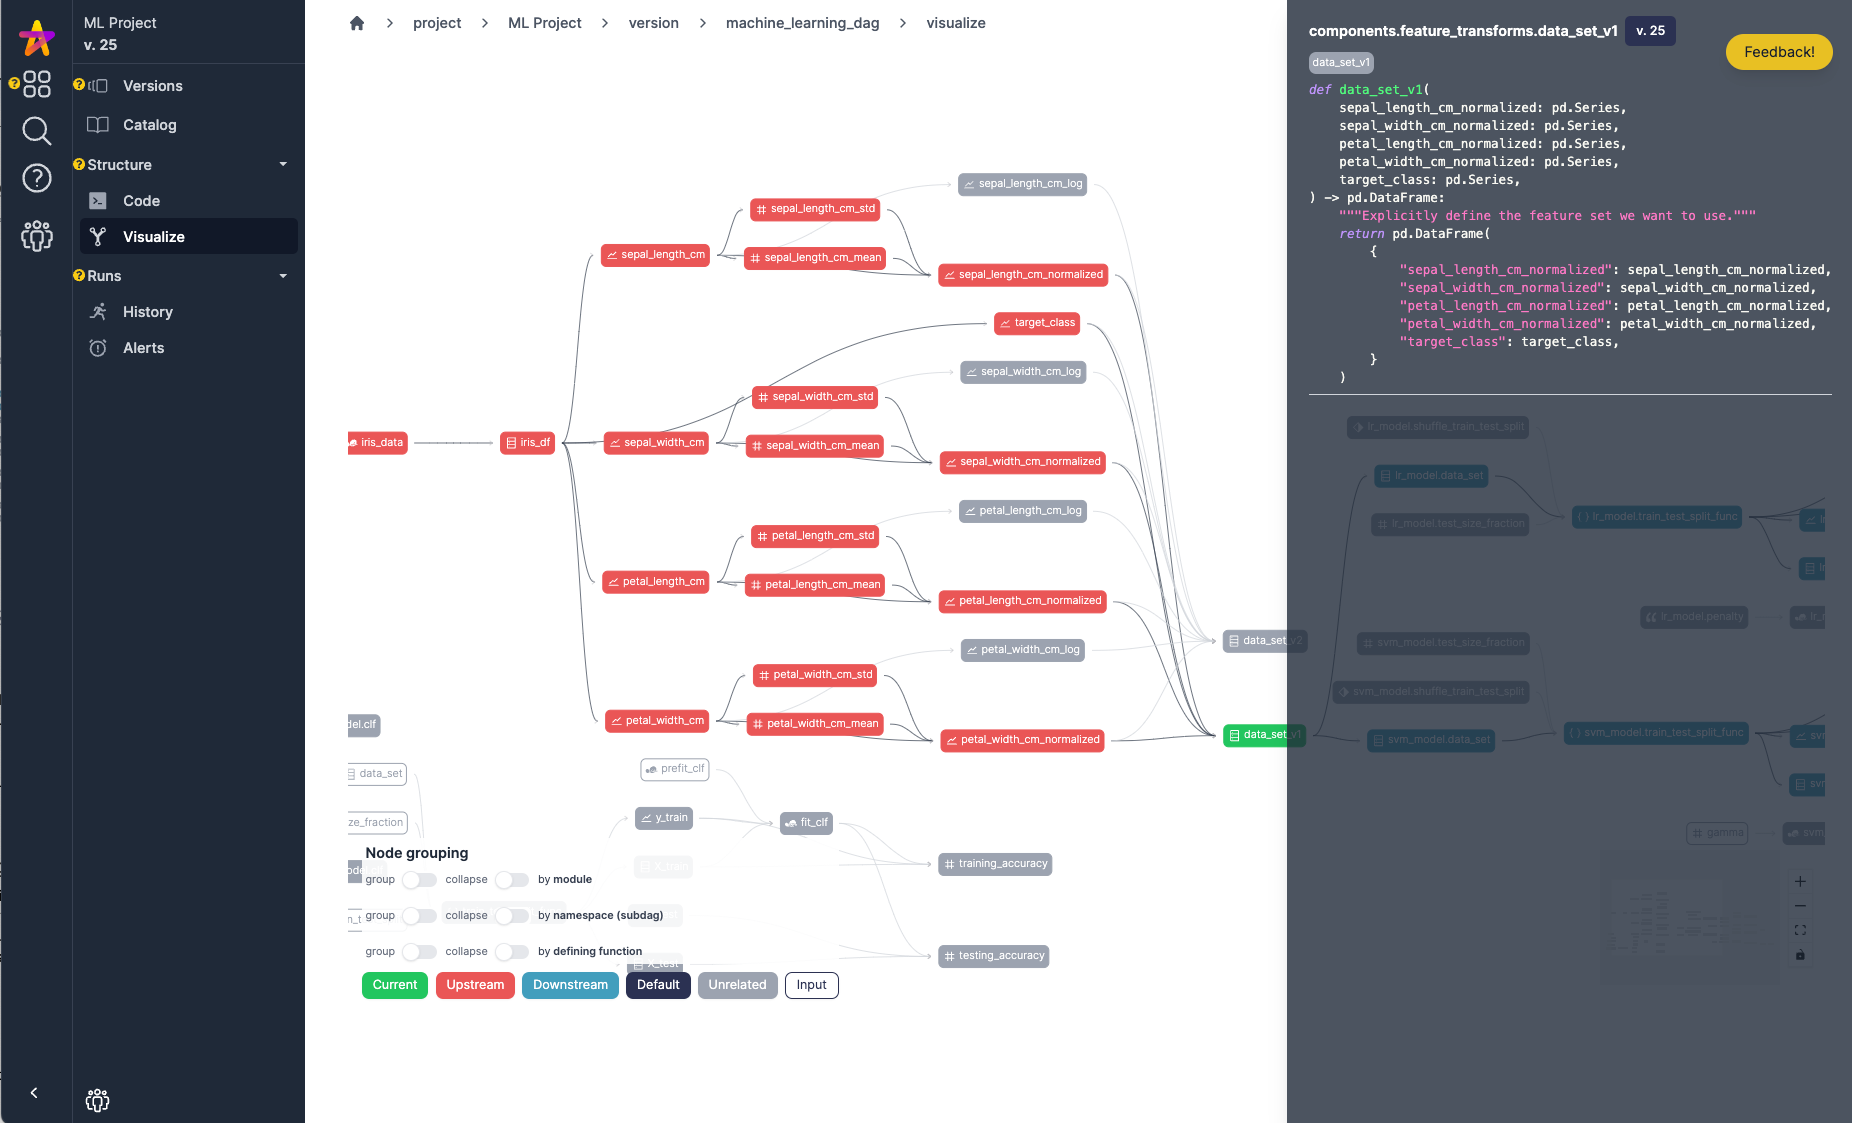
Interactive UI to see your DAG, code, and lineage / trace
Producing good documentation is a common afterthought, but with Hamilton this comes naturally. With the new UI, you can leverage that with an interactive UI that allows you to see and browse your code easily and quickly.
If you’re interested in a short video overview of some of the below features, watch this video.
See it all and understand what’s upstream and downstream of a particular function:
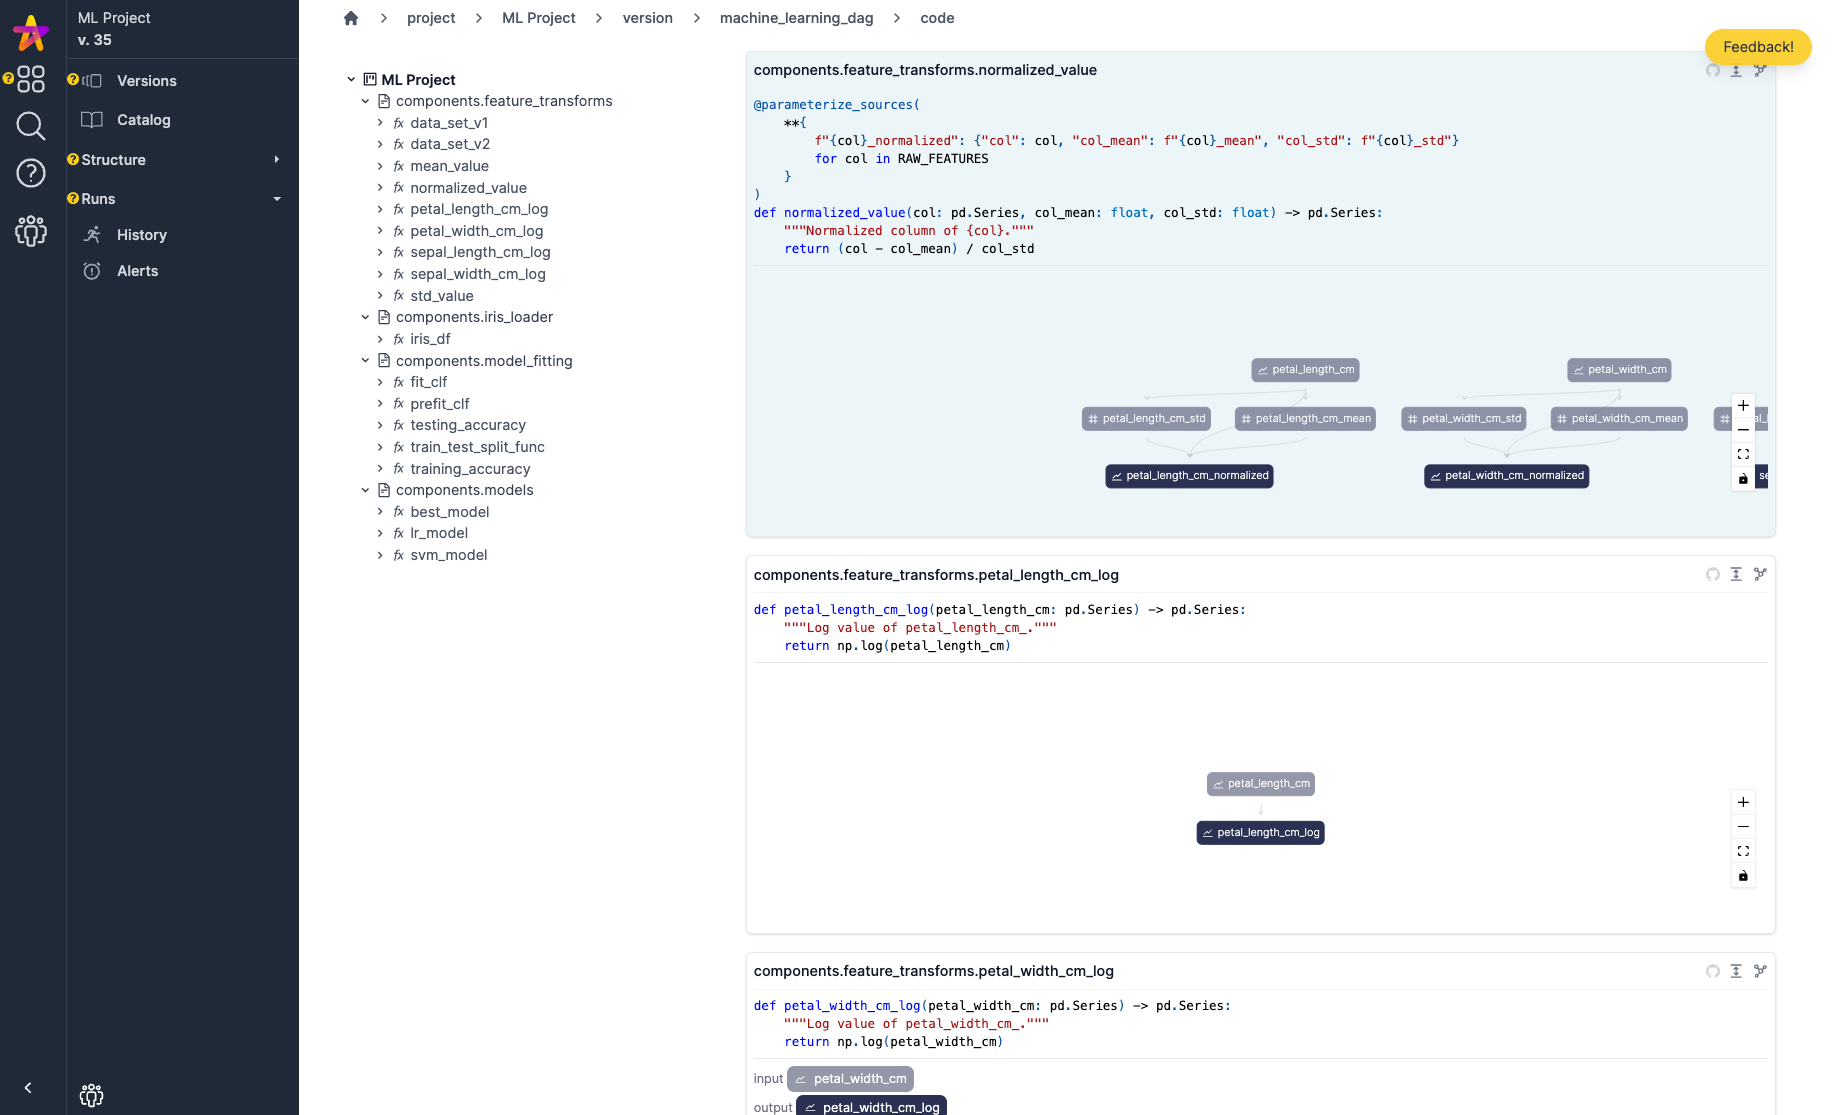
Quickly browse code for a particular function:
Or view code in the same view as you walk through it:
Auto populating transform and artifacts catalog
Unlike other systems that only give a view of generated artifacts (and require work to integrate with), with Hamilton you now have a combined artifact and transform catalog (e.g. a feature & model catalog) that auto-populates. Simply by running your Hamilton code, transform definitions and artifact metadata (using approved methods) are logged and available to view. This provides one with the ability to quickly and easily ask the question on always up to date information:
Transforms:
does this feature exist?
What’s its definition? What last used this code?
What artifacts (e.g. tables or models) does it feed into?
Artifacts:
What is this particular dataset?
How was it created?
What was the last execution that created it and what were its inputs?
Whether you’re using this locally for yourself, or in a team setting, you can always see what’s being used in a particular DAG.
Catalog view - see transforms – what versions they exist in, when they were last executed:
See artifacts – e.g. data sets produced - specified by data loaders, and data savers - and what versions they exist in and when they were last created.
Dive into artifact metadata: While the following UI is basic, it shows that rich metadata for what is read or written can be captured and then exposed and searched over.
Automatic code capture (provenance)
Data/ML/LLM work is iterative and can happen before code is committed. For example, in a Jupyter Notebook. This means that results can be hard to reproduce if you aren’t keeping track of the inputs, outputs, and importantly the code that was run. Similarly, if your build system copies code into a docker container, how do you easily identify the code version that is running in that container?
By simply adding the HamiltonTracker any execution is logged along with everything you’d need to recreate that run. What this means is that not only is the lineage between artifacts tracked, but also the code, i.e. the provenance, of how data was transformed into an output.
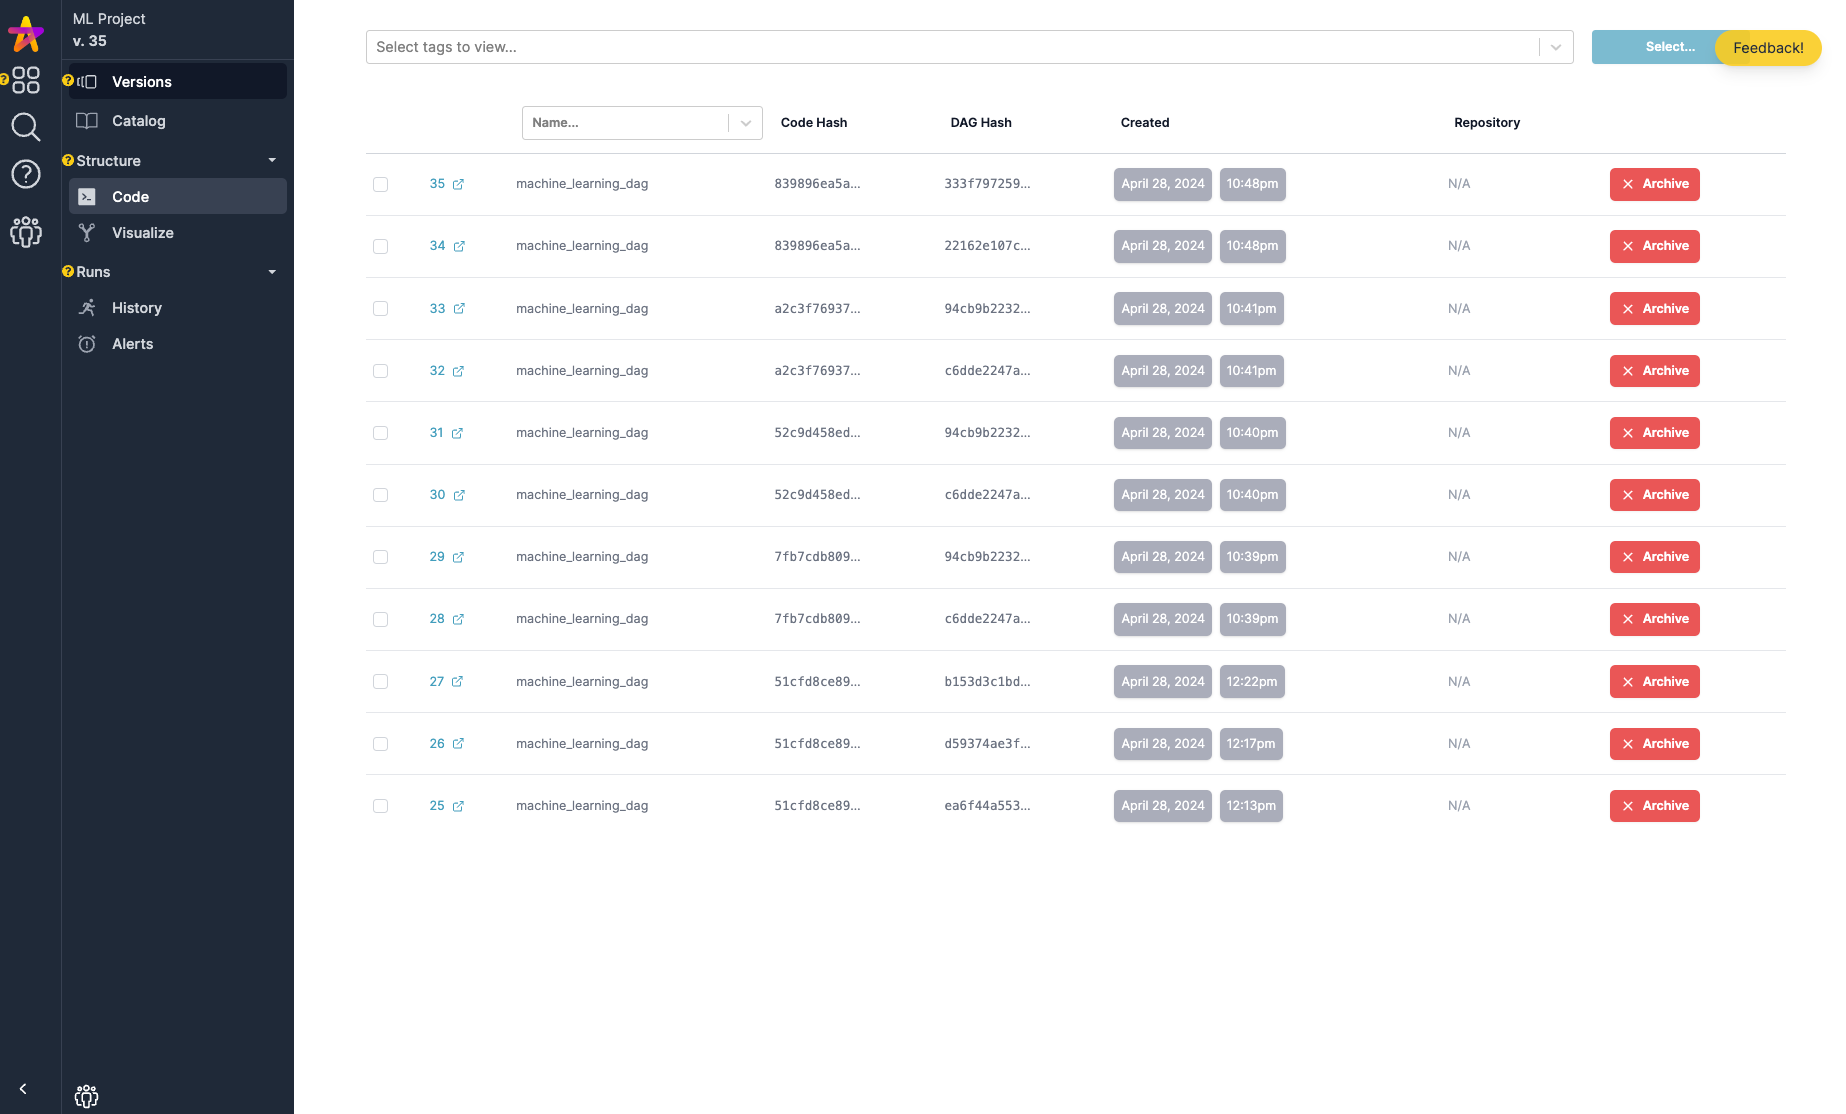
Specifically, every single run of your Hamilton code is tracked and versioned at the code and DAG level. Enabling one to easily see if it was code, or whether there were structural changes in the DAG between versions. The UI also has basic capabilities to compare versions.
Version View: You can filter by name, or tags, and at a glance get a sense for what changed based on hashes changing.
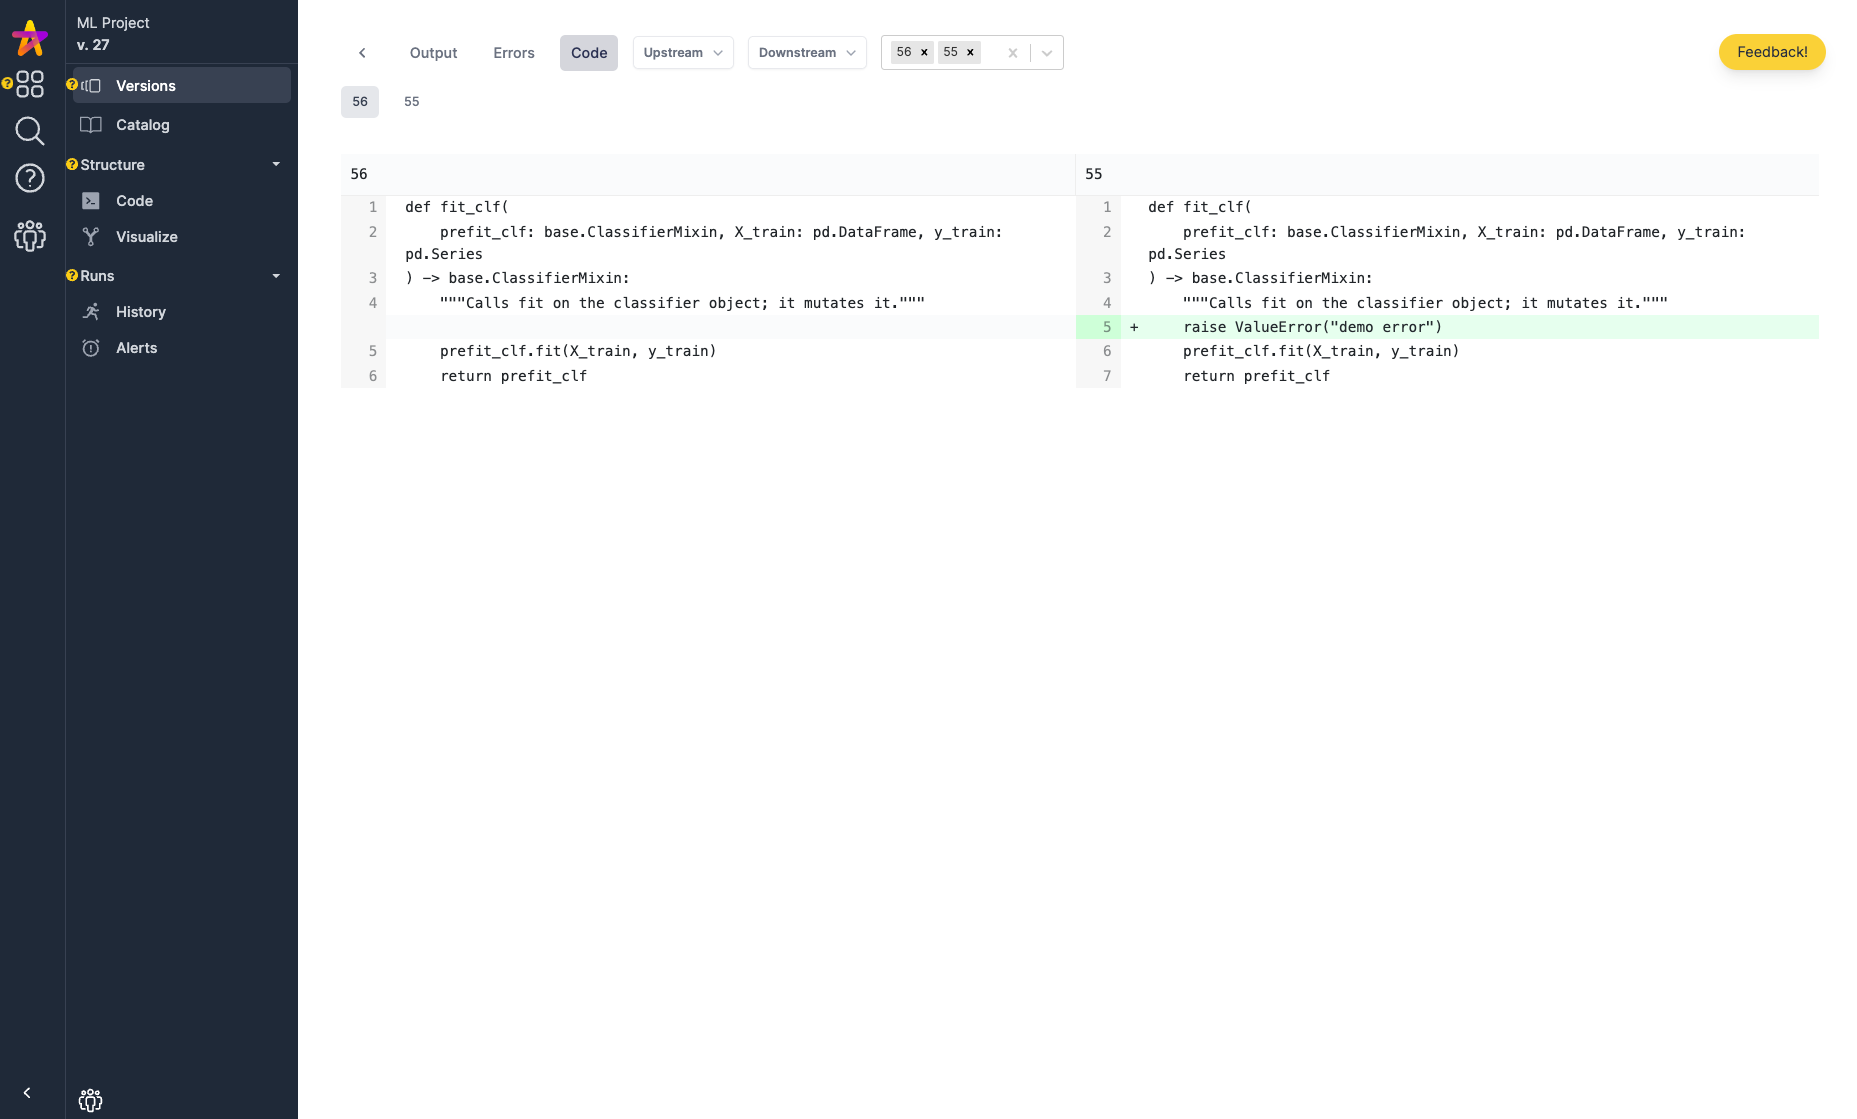
Code View: See the code that was captured along with what it creates in the graph.
Code & data observability: automatically track, view, profile, and compare executions
When your Hamilton code is executed with the attached HamiltonTracker, it is automatically profiled. It will then appear in an execution summary page where you can dig into a specific execution easily.
Execution Summary page: a basic overview of what ran and when
Profile view of an execution: we can easily see how long functions took.
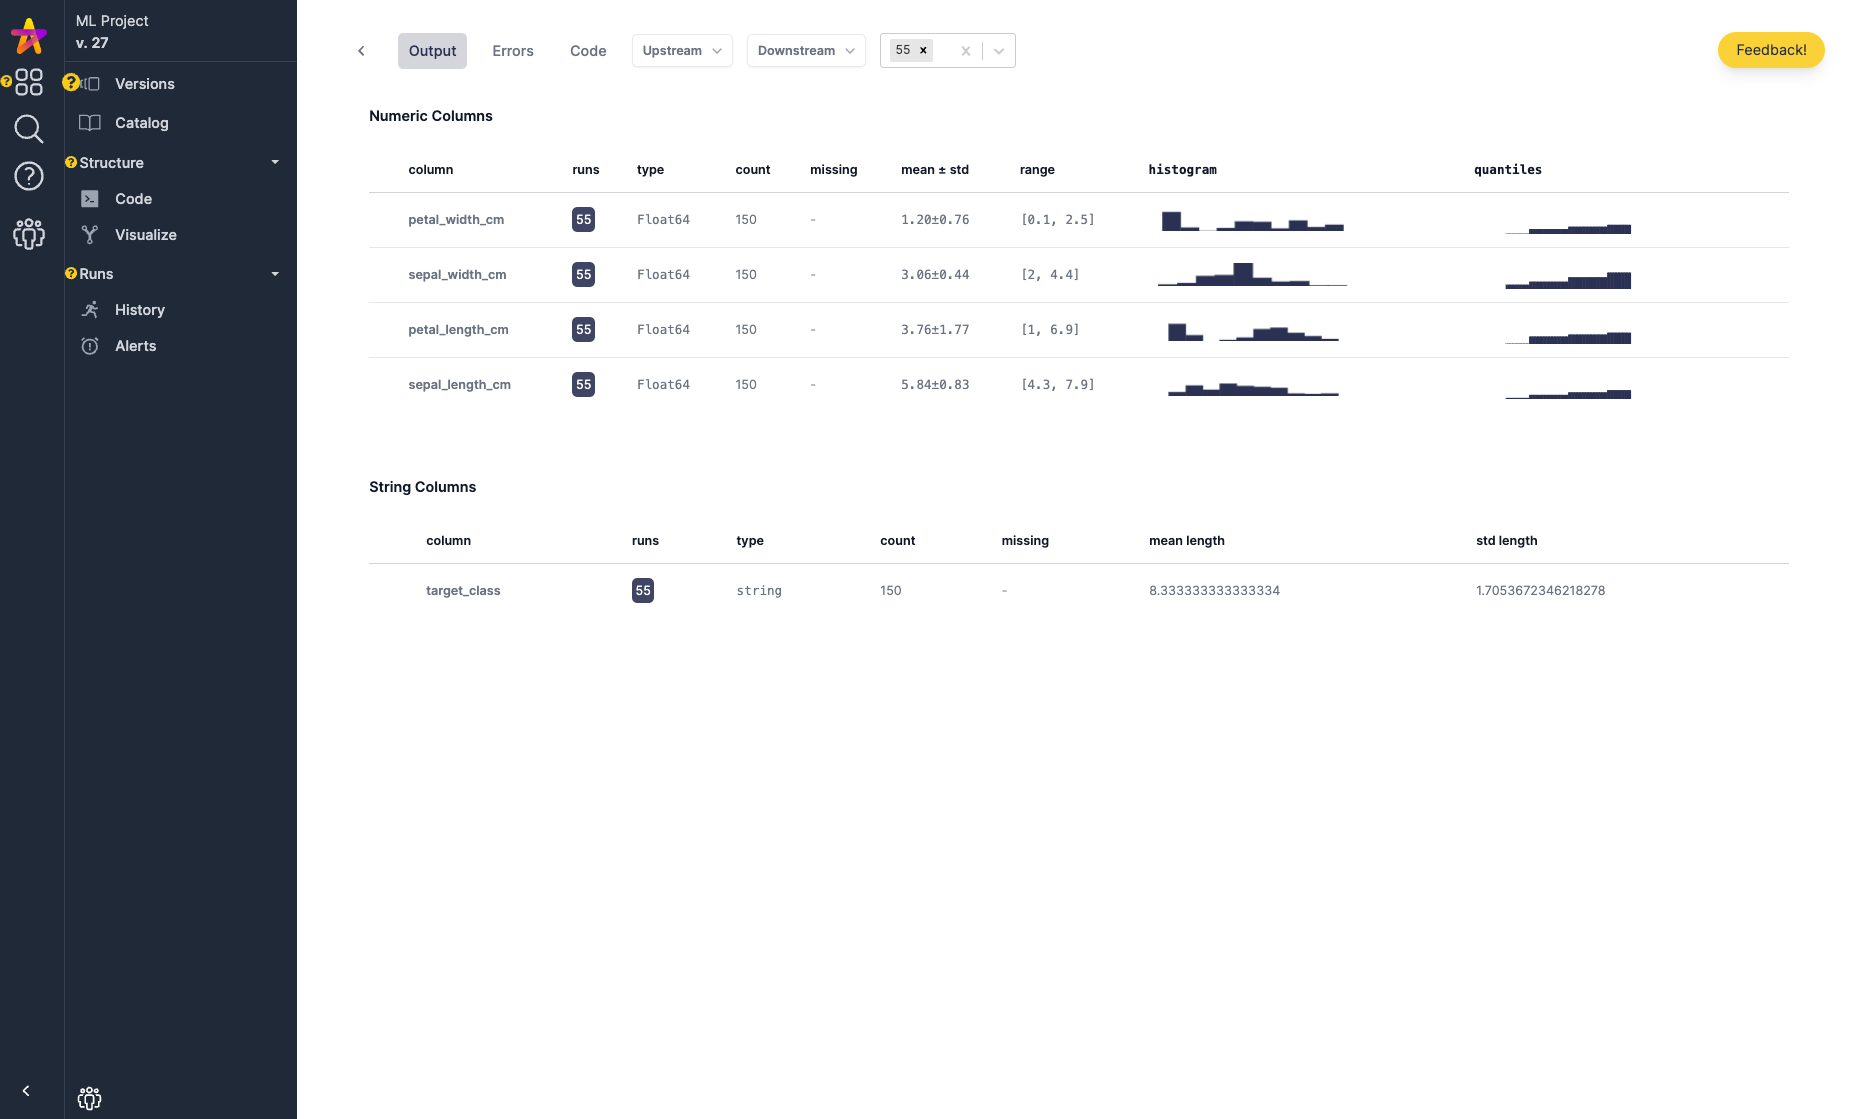
Data observability view: for each function run, lightweight data profiling & introspection of the outputs is possible. We have a base set of datatype covered here (pandas, polars, pydantic objects), but are looking to add more support here, e.g. more dataframe types like xarray, pyspark dataframes, etc.
Have you ever been stuck looking at stack traces & logs when trying to debug an issue (like the output of an Airflow job)? If you’re using Hamilton along with the HamiltonTracker, when presented with an error, you can quickly pinpoint the function, and then track down whether it was code or data that changed to cause the error using the execution comparison feature.
Error View: if errors come from within functions they are captured and obvious to spot:
Code Comparison View: we can compare two runs and see if code changed to help us diagnose this error (hint: in this case it was).
Data Comparison view: if it wasn’t code that changed, then perhaps it was the data. Because both code & data are tracked one can cross each hypothesis off the list quickly. To check if it was data, one can easily compare summary statistics collected from the output of functions to determine that. sepal_length_cm here has a difference in distribution:
Paid/Enterprise features
Hamilton is a powerful open source tool that powers feature & ML engineering, and LLM workflows in several enterprises. The Hamilton UI is now also open source for anyone to try locally and self-host. Note, if you are self-hosting, a license is required for the following features aimed at teams and enterprises:
Authentication
Project ACLs
Team & User management
Advanced reporting capabilities
Custom Hamilton integrations for your data system.
If you’re interested in these feature reach out to us for pricing and onboarding. We’re offering discounts to those that want to also partner on developing new features.
Note: there is a hosted Hamilton UI option, if you want to get your team up and running quickly on it. Sign up here.
Roadmap:
We’re excited by the feedback we’ve gotten thus far and have a lot of ideas to execute on. If any of the following speak to you, we’d love the feedback to help with prioritization, or even contributions!
Here’s some select roadmap ideas:
SDK Support to manage & query the metadata stored.
E.g. for CI systems.
E.g. for recreating errors.
Monitoring integrations.
Trigger alerts/warnings based on what can be observed.
Advanced search & filtering over catalog & artifact metadata.
Spark schema & explain capture.
Artifact storage – store more than just metadata.
Asynchronous Driver support.
Provide paths for non-Hamilton code.
Support ingestion of OpenLineage data.
Provide decorator based SDK to log non-Hamilton code.
Provide support for OpenTelemetry ingestion.
Please join our slack community to keep up to date with releases and progress.
Summary & what’s next:
In this post we announced a UI for Hamilton, and provided an overview of the new features that come with it.
You next step to get started with the Hamilton UI and its capabilities is to set up the self-hostable version of it. There are two options:
Local mode
Docker mode
Local Mode
You just need a way to pip install it. This will use a SQLLITE DB to persist data locally.
pip install "sf-hamilton[ui,sdk]"
hamilton ui
Docker Mode
If you’re running Docker, it’s straightforward, you should be up and running in < 15 minutes:
Checkout Hamilton
git clone https://github.com/dagworks-inc/hamiltonNavigate to the ui/deployment folder
cd hamilton/ui/deploymentExecute run.sh
./run.shThen create an email & project by hitting http://localhost:8242/.
Follow the instructions then to run your Hamilton code with the HamiltonTracker. If you run into issues, come ask for help in slack.
Or watch the getting started video here if you want to use docker:
Or if you’re after a quick overview of some features watch this video:


