Trace all parts of your Agentic/AI Applications with Burr
Use the @trace decorator to gain visibility into any functions called within Burr
Building reliable AI applications without visibility is a herculean task. While any well-designed application framework should include an open source UI for visibility, debugging capabilities, and integrations with common standards such as OpenTelemetry (Burr provides all of this + more), in our AI development work we have still found ourselves wanting additional visibility on demand.
Specifically, we usually break our application logic into functions – these functions call other functions, which call other functions, which eventually call out to a model or a vector DB. In order to understand both what happened and why it happened, we need insight into those functions.
This is why we built the `@trace` decorator — it enables us to flip a switch on any function called within a Burr step and gain full visibility into the inputs, the execution time, and the return value of that function.
In this post we will briefly go over Burr, talk about how to use the new @trace decorator, and how to explore the results in the Burr UI. We will then briefly talk about other instrumentation/visualization capabilities.
Note that the version of the Burr UI we show in this post is (as of August 23rd) available as an RC – we will be releasing it properly early next week!
Burr
Burr is a lightweight Python library you use to build applications as stateful graphs. You construct your application out of a series of actions (these can be either decorated functions or objects), which declare inputs from state, as well as inputs from the user. These specify custom logic (delegating to any framework), as well as instructions on how to update state. State is immutable, which allows you to inspect it at any given point. Burr handles orchestration, monitoring, persistence, etc.

You run your Burr actions as part of an application – this allows you to string them together with a series of (optionally) conditional transitions from action to action.
Burr comes with a user-interface that enables monitoring/telemetry, as well as hooks to persist state/execute arbitrary code during execution.
You can visualize this as a flow chart, i.e. graph / state machine:
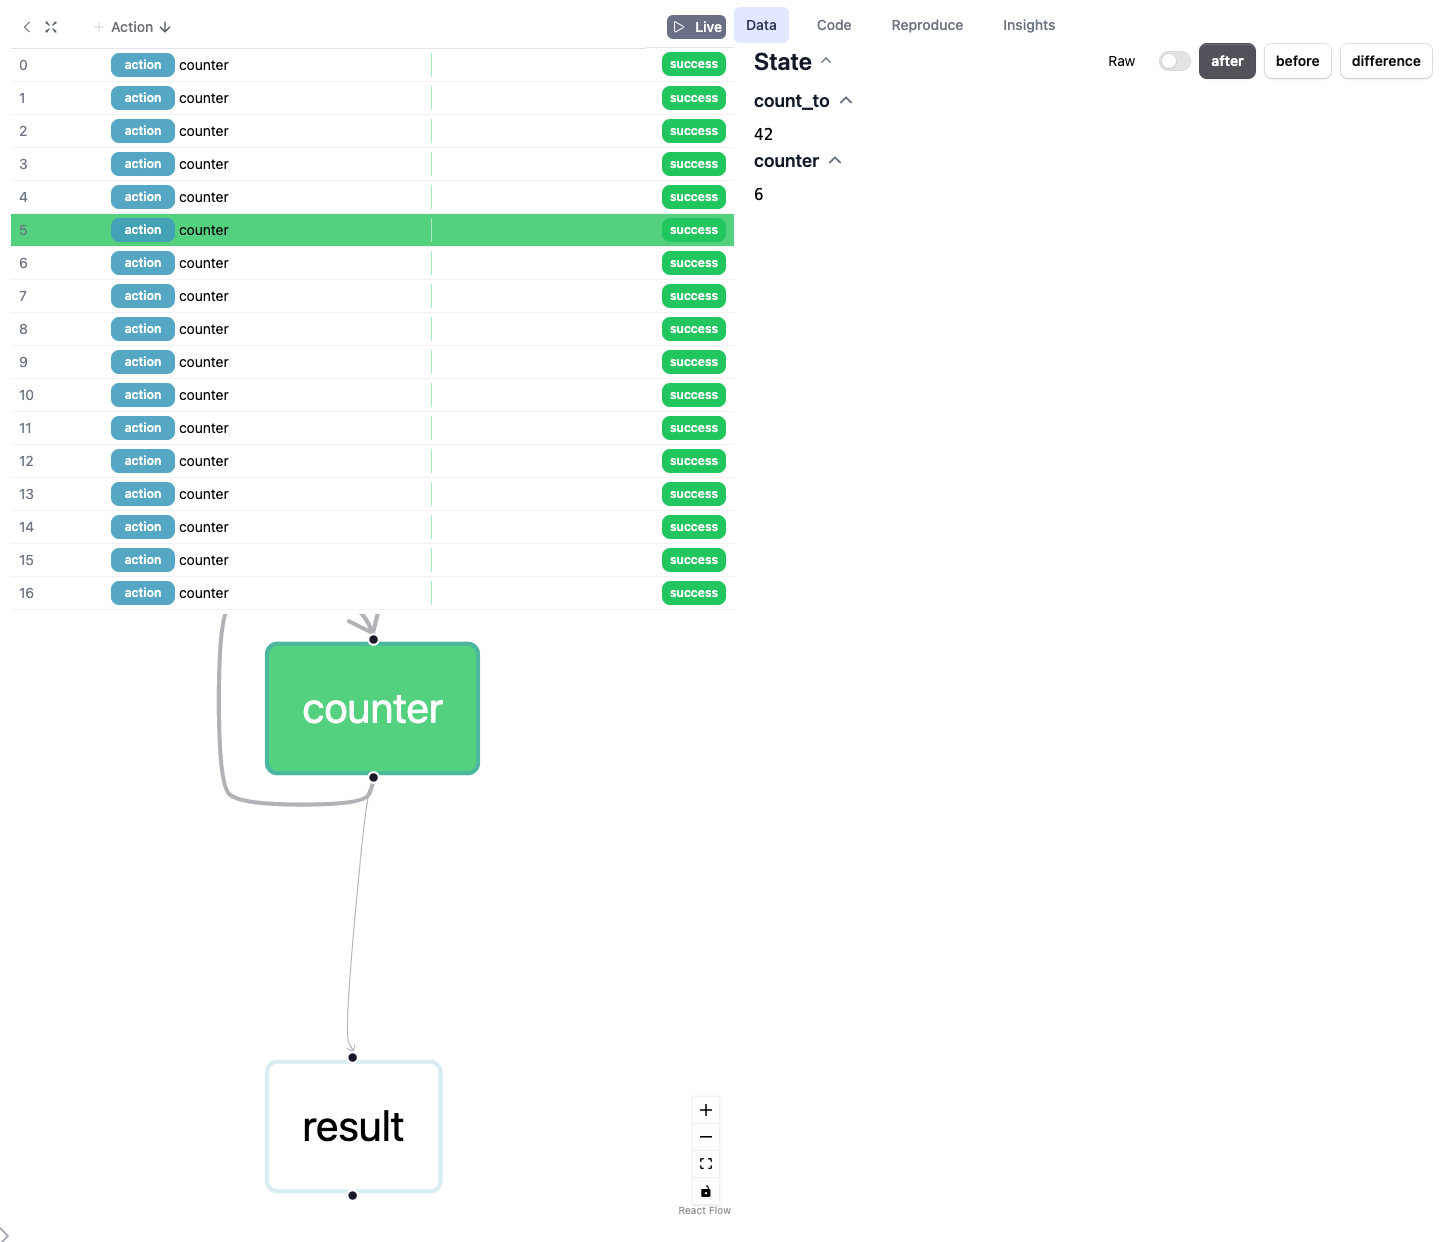
You can use the local telemetry debugger to view apps (which, as you will see, also provides some OpenTel integrations):
A Simple Agentic Chatbot
Let’s graduate from the hello world example and build something useful — a simple agentic chatbot that handles multiple response modes. It will be agentic as it makes multiple LLM calls:
A call to determine the model to query. Our model will have a few “modes” — generate a poem, answer a question, etc…
A call to the actual model (in this case prompt + model combination)
With the OpenAI API this is more of a toy example — their models are impressive jacks of all trades. That said, this pattern of tool delegation shows up in a wide variety of AI applications, and this example can be extrapolated cleanly. You will note this is a similar example to our prior visibility post — you can skim through if you’re on a visibility spree and just came from that one!
To leverage Burr, we model our application as a graph of actions. The basic flow of logic looks like this:
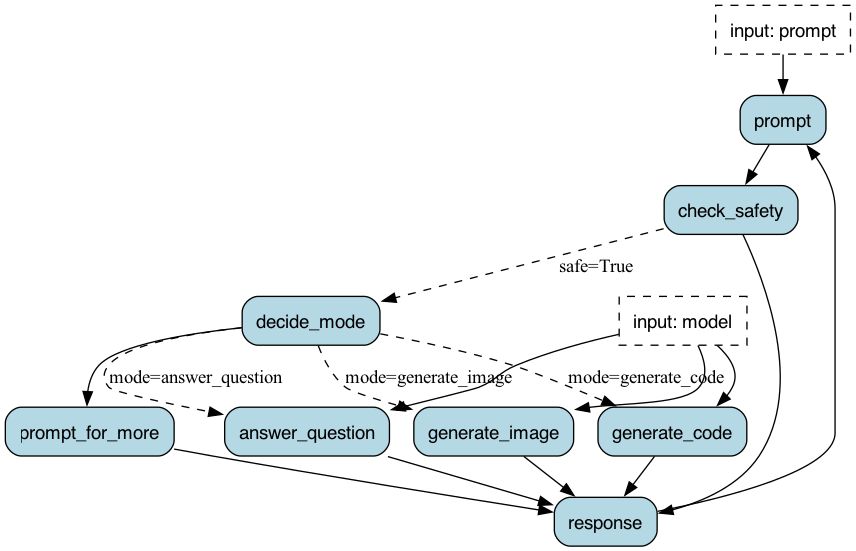
Let’s take a look at the chat_response function that powers the nodes answer_question and generate_code, depending on the value of prepend_prompt:
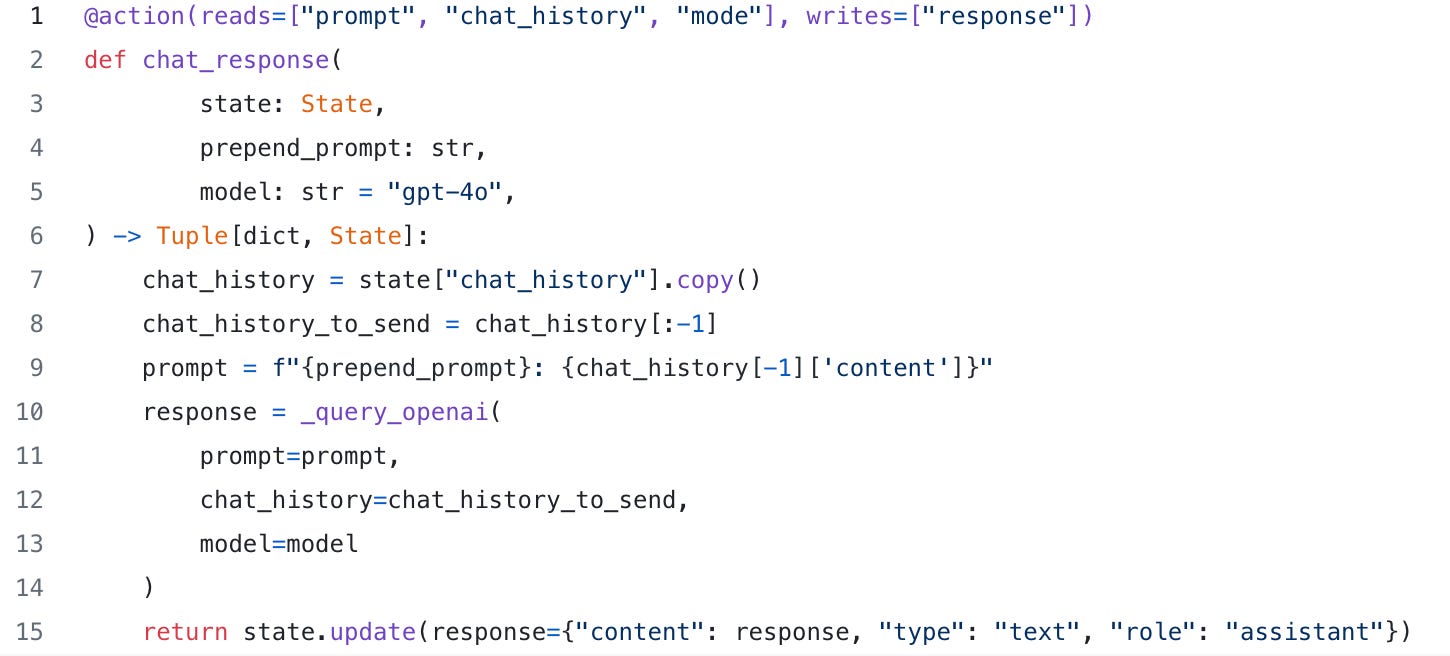
You will note that this uses the helper function _query_openai, which can easily be adjusted to query any LLM. We will be instrumenting this in a bit.
The graph creation + instantiation looks similar to what we showed above (a few pieces left out for brevity). Note we’re reusing some functions (chat_response), by binding different function parameters to create different nodes in the graph.
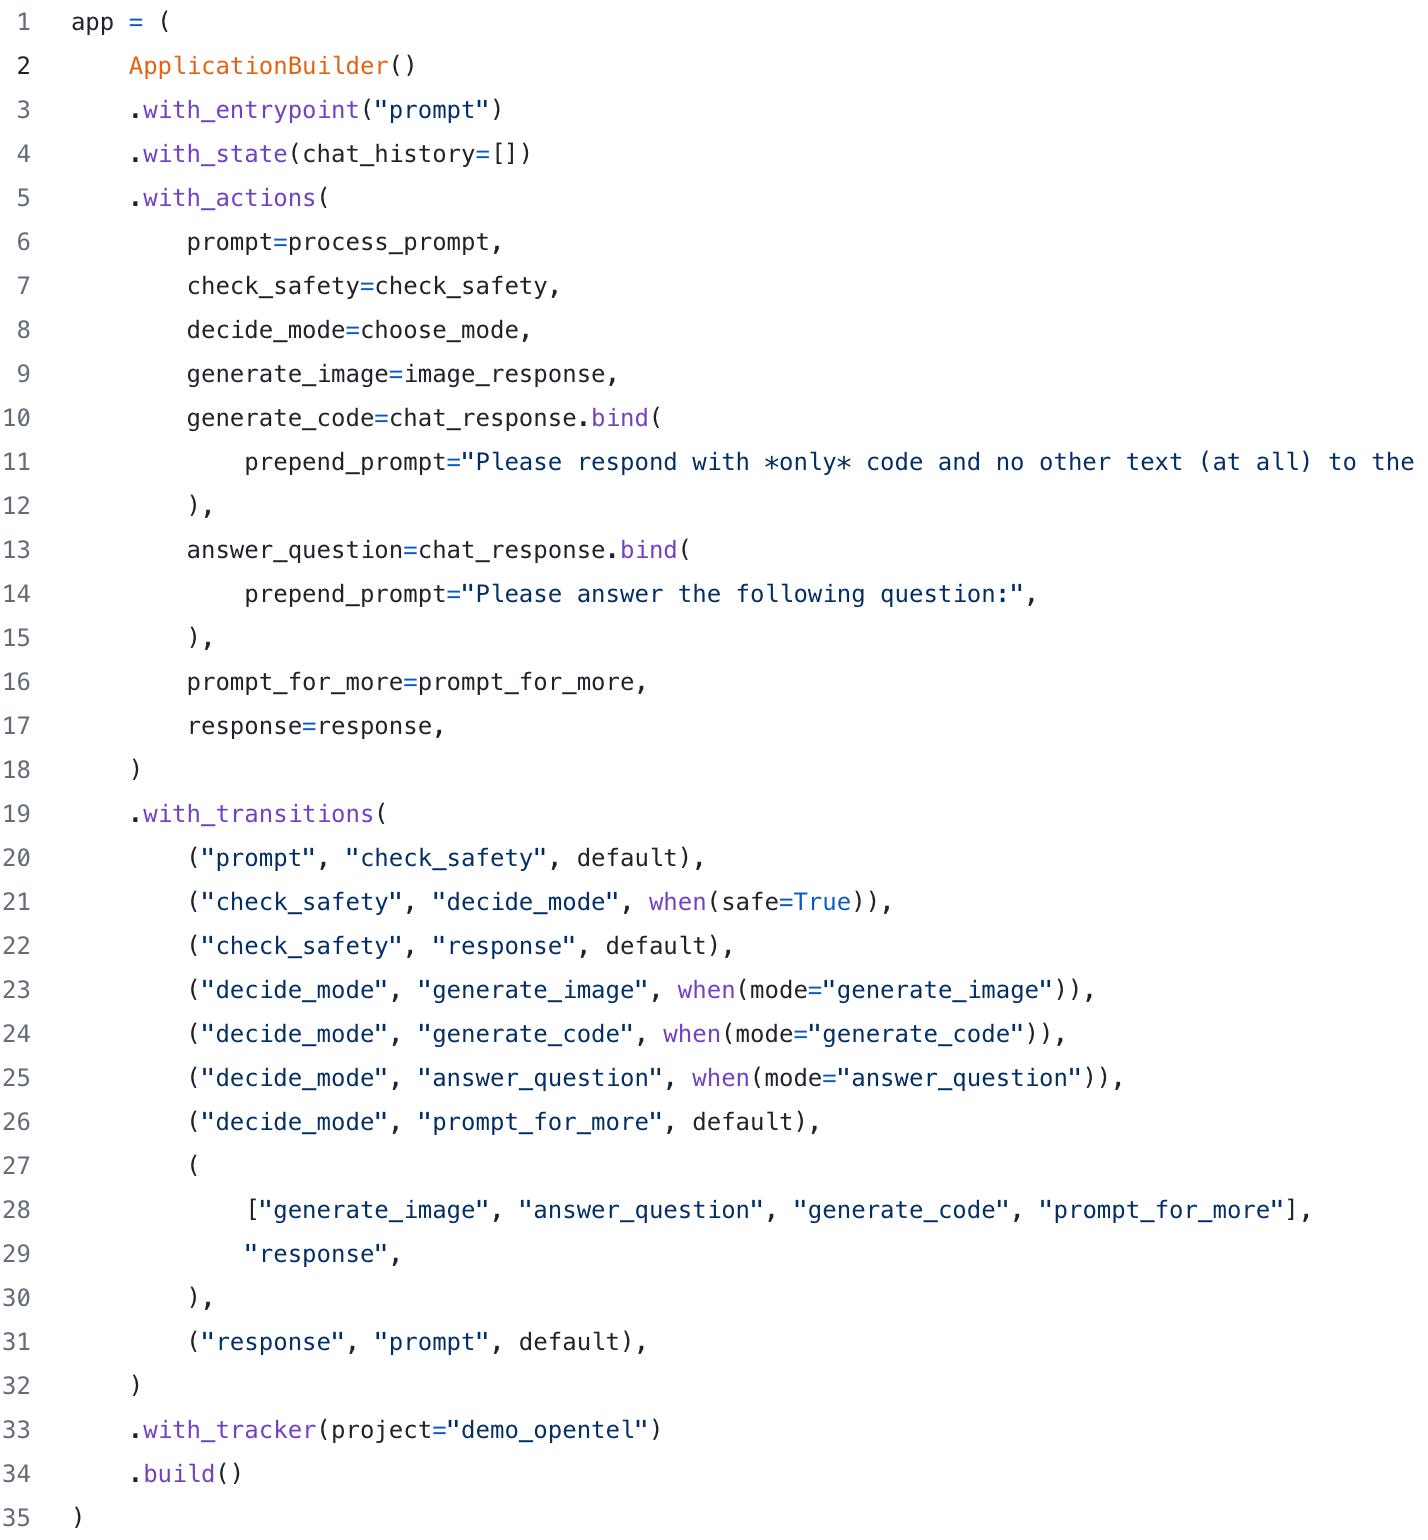
Gaining Visibility
We can explore how this looks in the UI. The following is from two prompts in a row
As you can see, we have some access to data, input, etc.. through the view, but we don’t have the internals of how the prompt was manipulated.
Using the @trace decorator
With the @trace decorator we can augment the data above. Specifically, we’re going to surround two of our functions with @trace to gain insight into how they work. The _query_openai method because it is useful, and the _get_openai_client method for fun.
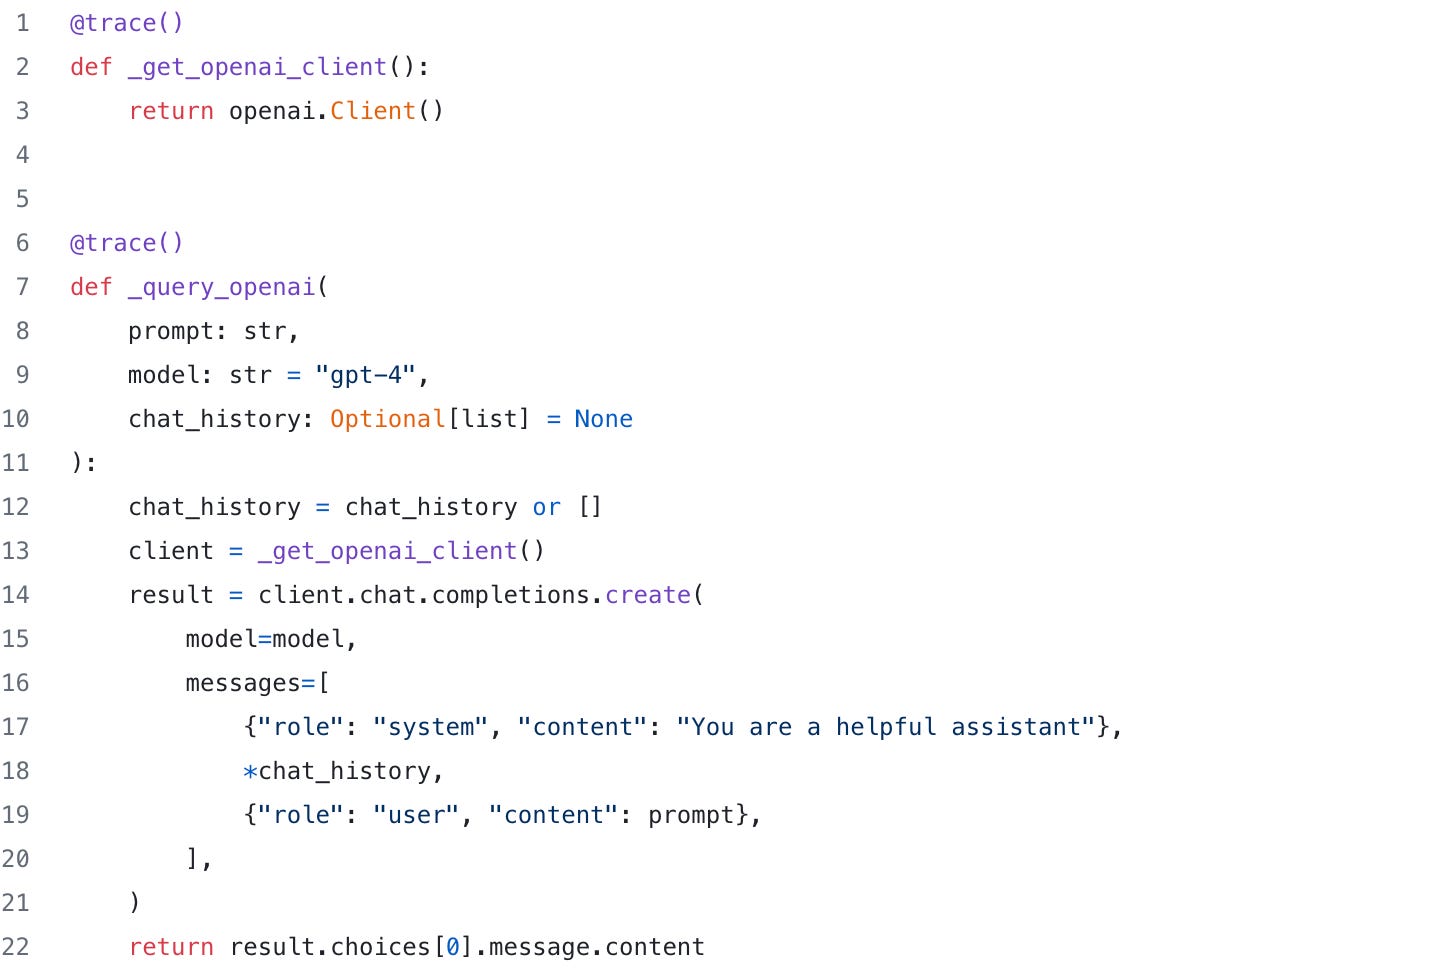
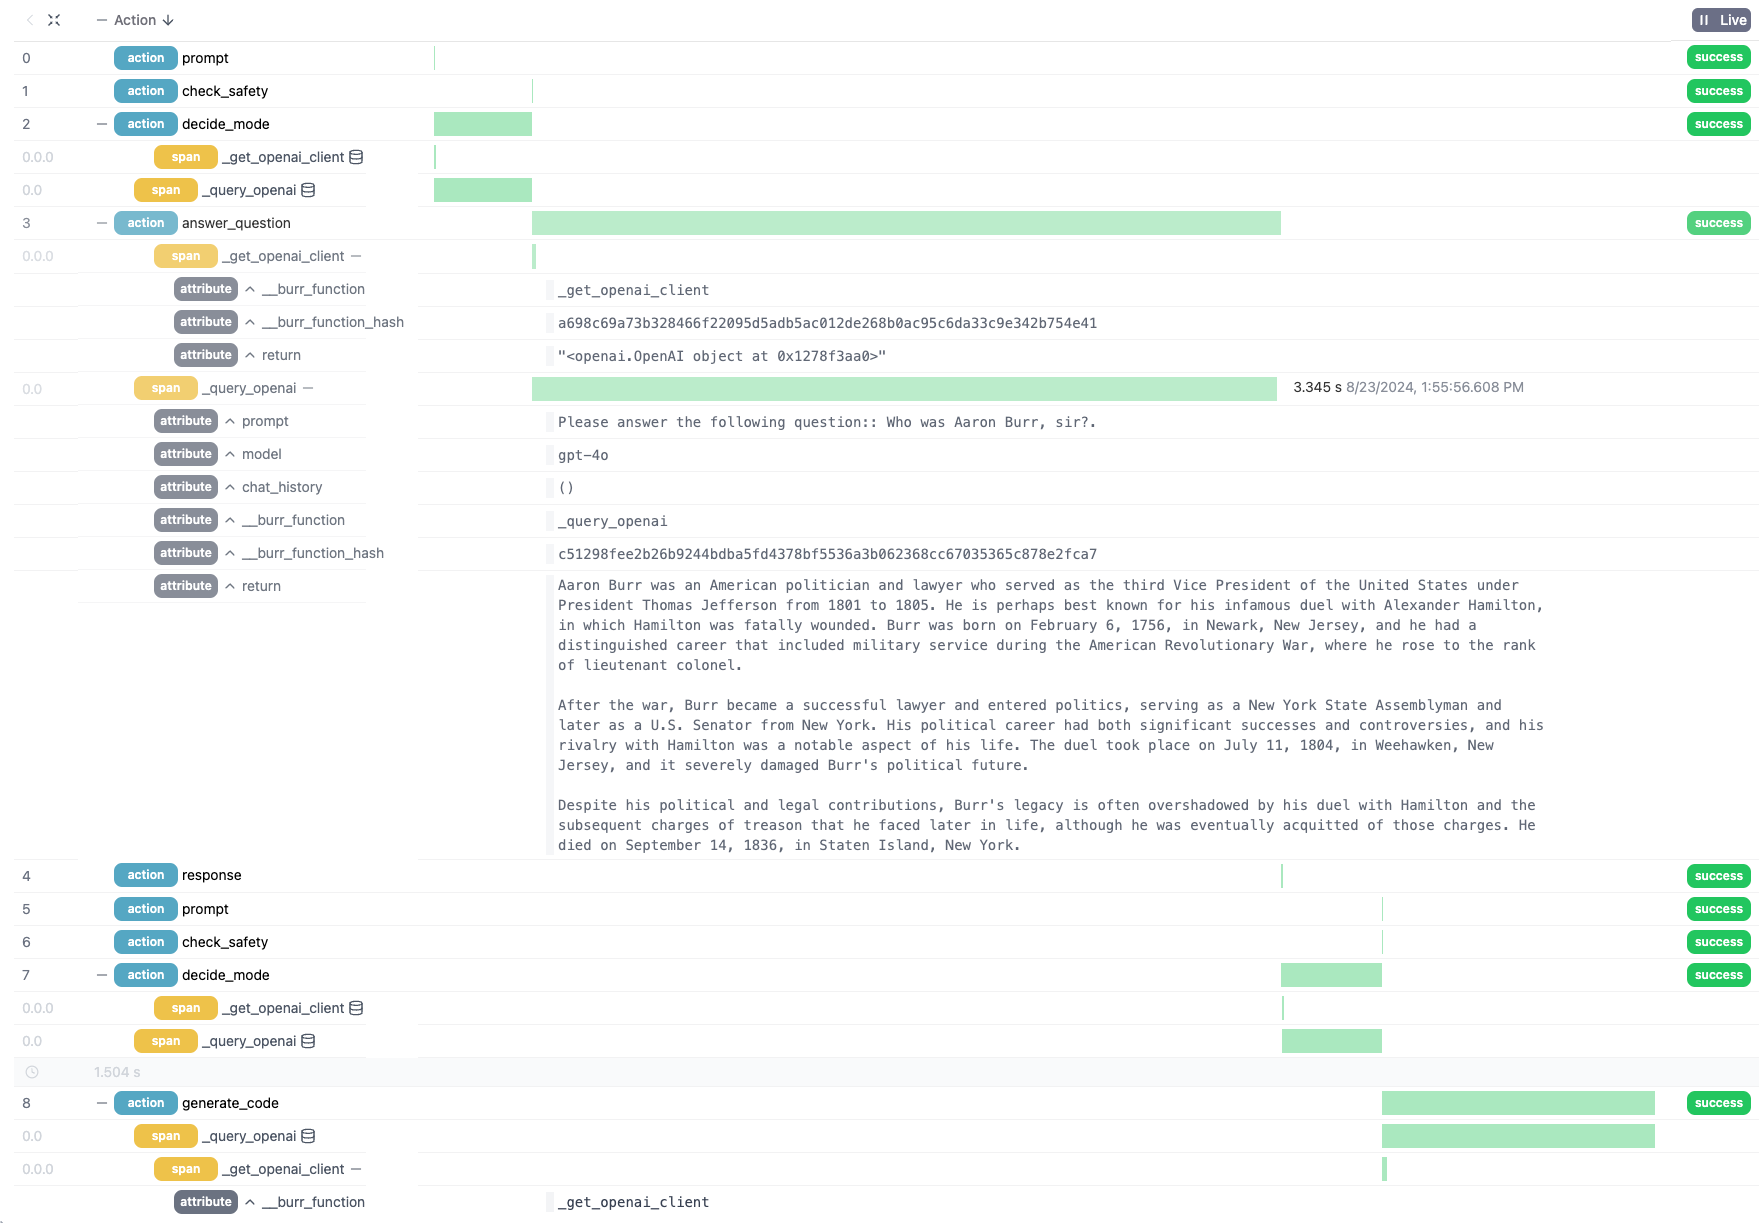
We can view the spans (toggled globally by the +/- button near the action header, or the +/- button near individual actions), we can see that a set of spans have been logged that correspond to a set of attributes (see the inline database icon):
Clicking the database icon to the right of a span opens up the attributes logged and gives us insight into the parameters (prompt, model, chat_history), as well as the return value (labeled return):
Not only can we see the full prompt (see `prompt` attribute), but we can also tell that we have an additional colon (`::`), and that it took 3.345 seconds to respond. We also have some simple debugging information on the function that was instrumented and the hash of the code. This response glosses over the treason, name change, failed marriages, and financial challenges that plagued him later in life.
Further Instrumentation
That said, this is just a toy example. The true power of AI does more than provide answers a simple wikipedia article would show, and Burr can be used for a lot more than just a chatbot.
The @trace decorator makes this feasible – instead of just gaining visibility at the Burr level (state, results), you can dig in as deep as you want.
In addition (and in complement) to the trace decorator, you can auto-instrument most of the popular (vendor and OS) model providers & vector databases, as well as leverage any other instrumentation. You can view all this data in the Burr UI, in your favorite OTel provider, or both! See our previous writeup for more information.
More Resources
Join our Discord for help or if you have questions!
Github repository for Burr (give us a star if you like what you see!)


