Building Generative AI / Agent based applications you can monitor with OpenTelemetry
An overview of OpenTelemetry and the integration with Burr.
One of the most challenging aspects of building Generative AI applications is understanding what happened and why it happened. In addition to the standard monitoring concerns (how long did this step take, what caused the exception the program threw, etc…), we have to deal with a plethora of Generative AI-specific challenges. Did this model get fed a reasonable prompt? Did it produce a reasonable result? If not, why? When you’re building agentic applications (those that leverage AI calls to make automated decisions), this gets even more complicated.
In this post, we’re going to talk about how you can leverage the industry-wide OpenTelemetry standard to instrument Generative AI applications built with Burr and provide visibility into the aforementioned questions. We will present the basics of OpenTelemetry, walk through a simple application implementation with Burr, and show how you can get visibility over the decisions your “AI/Agent” make in a few lines of code, using your preferred OpenTelemetry vendor along with the builtin Burr UI. We will then show how you can utilize custom instrumentation to gain additional monitoring for Generative AI-specific concerns.
OpenTelemetry
OpenTelemetry, or OTel for short, is a standard that has skyrocketed in popularity in recent years. It is a CNCF incubating project, with an open governance model to ensure no single vendor steers it too much in any specific direction.
It is now supported by a large array of vendors, ensuring that how you instrument is not a cause of vendor lock in, which forces observability companies, i.e. those that ingest OpenTelemetry data, to compete by building better features.
OpenTelemetry defines how applications can export the following information:
Traces – a request’s journey as it travels through the application
Metrics – various data points (aggregate or individual) that represent some observation of the application at a given point in time
Logs – what the application printed while running
In this post we will be focusing on traces, which OpenTelemetry models with the following concepts:
A span – an individual component of execution with a start/end time and exception data attached to it. This can be recursive – spans can have sub-spans, etc…
A trace – a group of spans that represent a journey through the application
Attributes – data attached to a span to make debugging easier.
OpenTelemetry provides APIs for ingesting this data, as well as client-side tooling that implements this. In python, the opentelemetry-api package defines high-level interfaces, and the opentelemetry-sdk as a default implementation, is provider-agnostic client.
Using OpenTelemetry tracing in python is simple – you just need to get the global tracer and exercise it:

So, OpenTelemetry is popular and easy to use, but why should you consider using it, and how can it help with AI observability?
OpenTelemetry is vendor (a.k.a. visibility provider) agnostic, meaning that you can easily switch between vendors. In this case we’ll be using Traceloop to demonstrate, but you can easily get started on any of these.
OpenTelemetry is openly governed, meaning that you can dig in to understand the decisions they made and even be a part of it!
Data visibility is the first step to understanding the questions of why a model made the decision it did — OpenTelemetry provides this with tracing and attributes (logging the input/output/other model data).
There are a host of extensions available to OpenTelemetry — in this case we will be using Traceloop’s open source openllmetry library to automatically instrument our LLM calls as it supports many LLM & vector DB client SDKs.
Burr
Burr is a lightweight Python library you use to build applications as stateful graphs. You construct your application out of a series of actions (these can be either decorated functions or objects), which declare inputs from state, as well as inputs from the user. These specify custom logic (delegating to any framework), as well as instructions on how to update state. State is immutable, which allows you to inspect it at any given point. Burr handles orchestration, monitoring, persistence, etc…).

You run your Burr actions as part of an application – this allows you to string them together with a series of (optionally) conditional transitions from action to action.
Burr comes with a user-interface that enables monitoring/telemetry, as well as hooks to persist state/execute arbitrary code during execution.
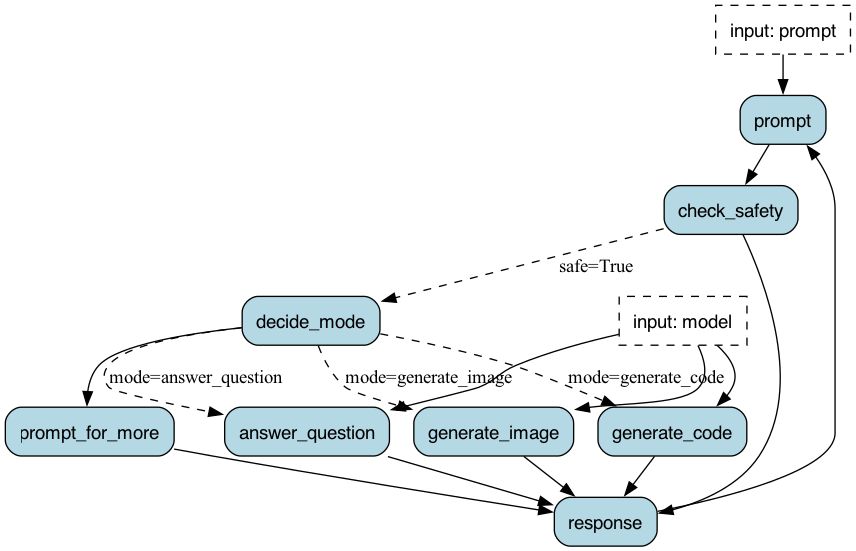
You can visualize this as a flow chart, i.e. graph / state machine:
You can use the local telemetry debugger to view apps (which, as you will see, also provides some OpenTel integrations):
A Simple Agentic Chatbot
Let’s graduate from the hello world example and build something useful — a simple agentic chatbot that handles multiple response modes. It will be agentic as it makes multiple LLM calls:
A call to determine the model to query. Our model will have a few “modes” — generate a poem, answer a question, etc…
A call to the actual model (in this case prompt + model combination)
With the OpenAI API this is more of a toy example — their models are impressive jacks of all trades. That said, this pattern of tool delegation shows up in a wide variety of AI applications, and this example can be extrapolated cleanly. You will note this is a similar example to our prior streaming post.
Modeling our Application
To leverage Burr, we model our application as a graph of actions. The basic flow of logic looks like this:

Let’s take a look at the decide_mode function – this is a simple call out to OpenAI (one of a few in the stack).

As you can see, we are directly using the OpenAI API, and parsing the result (note that instructor or OpenAI structured outputs would likely be a better choice to force the mode to produce what we want, blog post coming soon!).
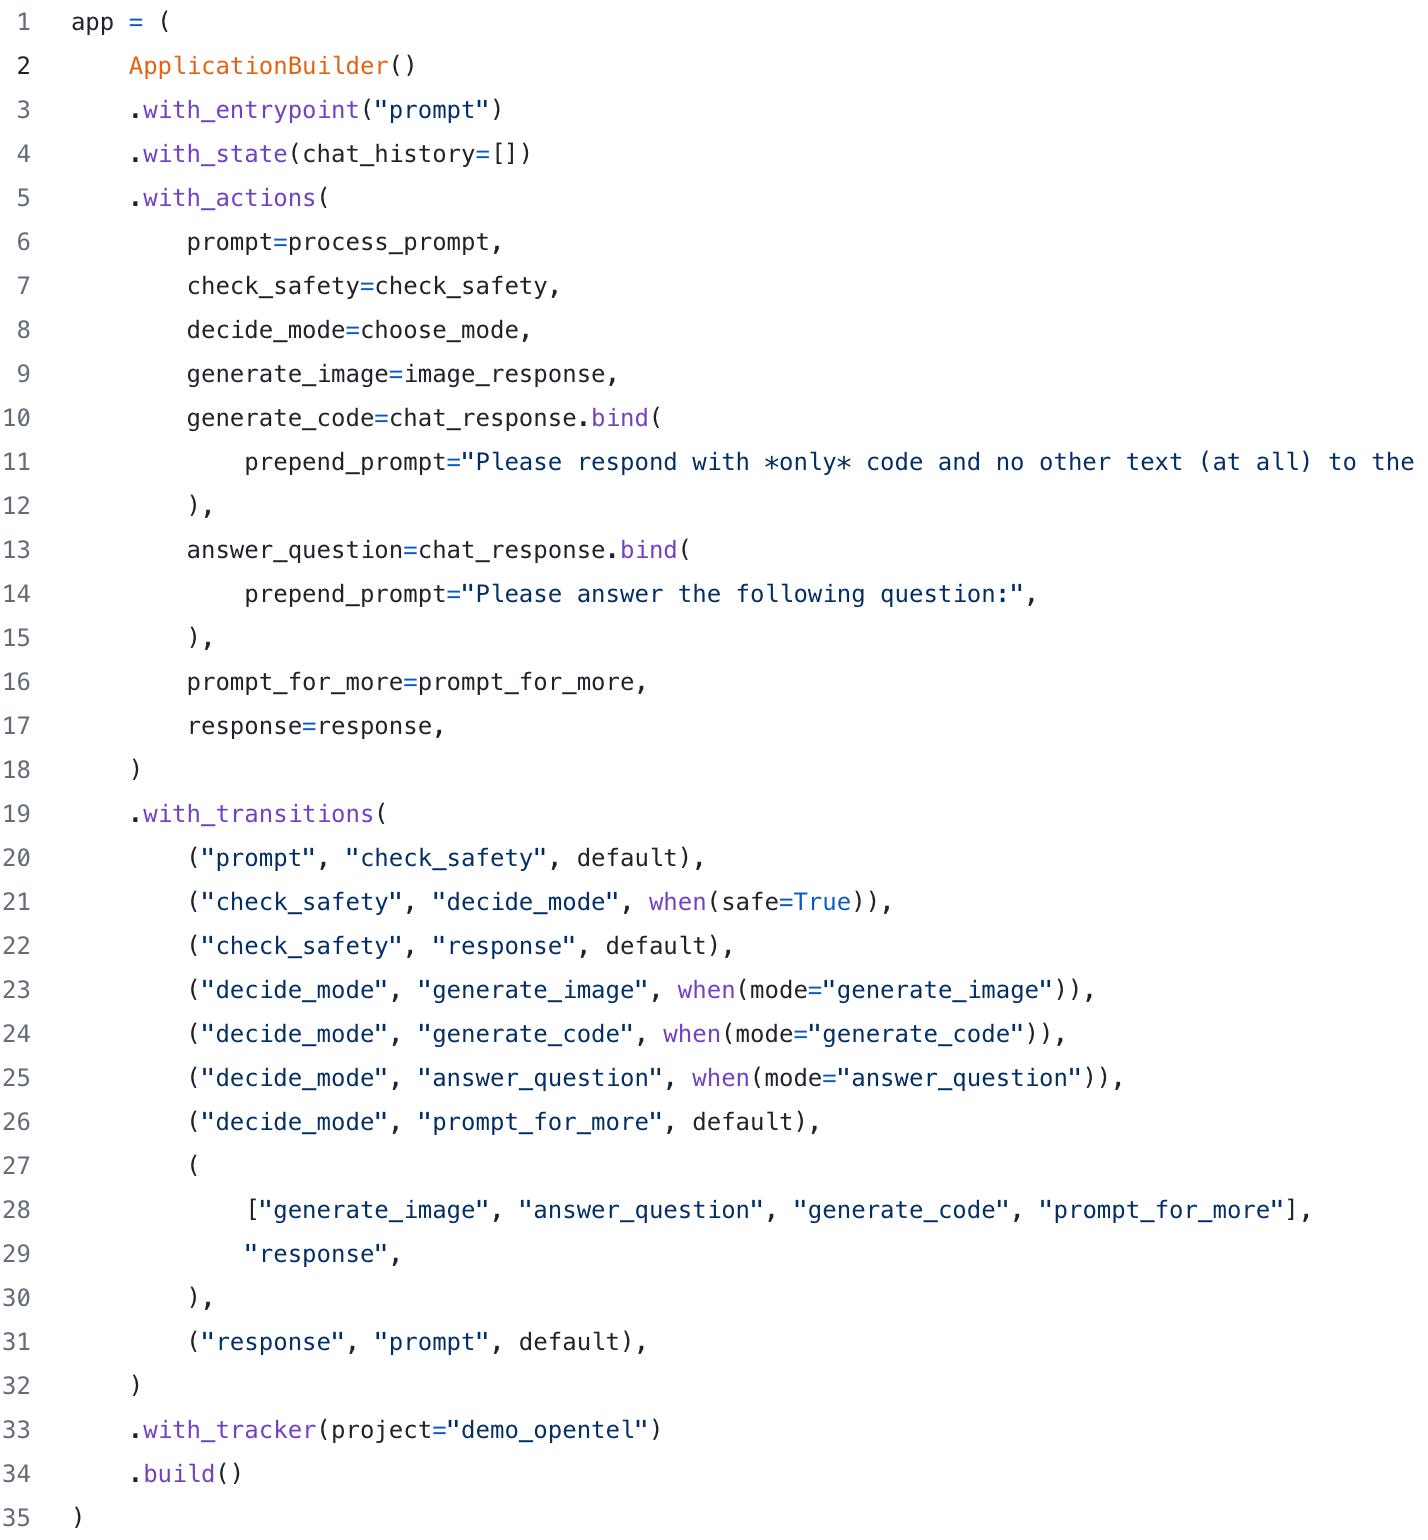
The graph creation + instantiation looks similar to what we showed above (a few pieces left out for brevity). Note we’re reusing some functions (chat_response), by binding different function parameters to create different nodes in the graph.

Manual Instrumentation with OpenTelemetry
We have two ways of manually logging custom OpenTelemetry traces with Burr:
The Burr tracing SDK
The OpenTelemetry SDK
We’ll show the Burr API (1), but you can use the OpenTelemetry SDK interchangeably — it will all get logged to the same place. To add custom traces, we can do something like this manually:

Then to run, we add a simple hook. This ensures that framework calls (E.G. to app.run()...) are traced as well.

Generative AI-specific OpenTelemetry
OpenTelemetry defines a set of attributes specifically for tracking AI applications. This enables us avoid the manual instrumentation we did above, and instead get it for free!
These take the form of semantic conventions that give some very simple model-related parameters. Furthermore, Traceloop has implemented a variety of SDKs that automatically instrument common clients. You can access them with Traceloop here (and, if you initialize with traceloop, they get automatically set up).
Thus to automatically instrument most gen AI applications, you simply need to call instrument on the appropriate object:

While this is not required for the basics of monitoring with Burr, the auto-instrumentation libraries follows the semantic conventions and logs attributes that are useful in giving insight to the model, as well as the cost of execution, e.g. how many tokens were sent and how many were generated.
Putting this all together, we can see our spans get populated in Traceloop!
Logging OpenTelemetry Traces to Burr
We can take the same traces we logged above and flip a simple switch to log them via Burr’s tracking hooks — this will log to the local Burr server and show the traces in the context of a Burr execution.

We can see traces in the Burr UI with a similar view, as well as associated attributes on a span level:
Wrapping Up
We showed how to gain visibility by leveraging OpenTelemetry. In addition to providing insight into system performance, OpenTelemetry (through either the Burr UI or a OpenTel vendor) affords us visibility into every aspect of our application – the inputs/outputs of models, and how downstream processes leveraged that. So, circling back to what we wanted to know initially:
Did this model get fed a reasonable prompt?
Did it produce a reasonable result?
If not, why?
(1) and (2) are directly answered by attribute-logging with OpenTelemetry, whereas (3) will always be a bit of a guessing game. That said, knowing the facts (inputs and outputs) is the first step to understanding the why, and Burr has features to help you “replay” / go back in time to quickly debug or try different code paths, providing an integrated development & observability experience.
Lastly, OpenTelemetry traces support crossing service boundaries. So, if you are self-hosting your LLM and really want to get into the nitty-gritty, you can instrument your model service and report traces back to, say, Traceloop or Burr, gaining visibility into the model along with the application.
More Resources
Join our Discord for help or if you have questions!
Github repository for Burr (give us a star if you like what you see!)


